
Conversational AI
Consumer Data: 7 in 10 Car Owners Choose Voice AI Over Hold Times
By Telnyx Expert Team
Key findings:
- 64.2% prefer AI voice for service scheduling over waiting on hold
- 63.3% would use AI voice for pricing and trade-in info instead of web forms
- Agreement holds across all five touchpoints, from the showroom (63.3%) to the roadside (53.2%)
The Dealership Bypass
I'd use a dealership AI voice agent for pricing, inventory, and trade-in info.
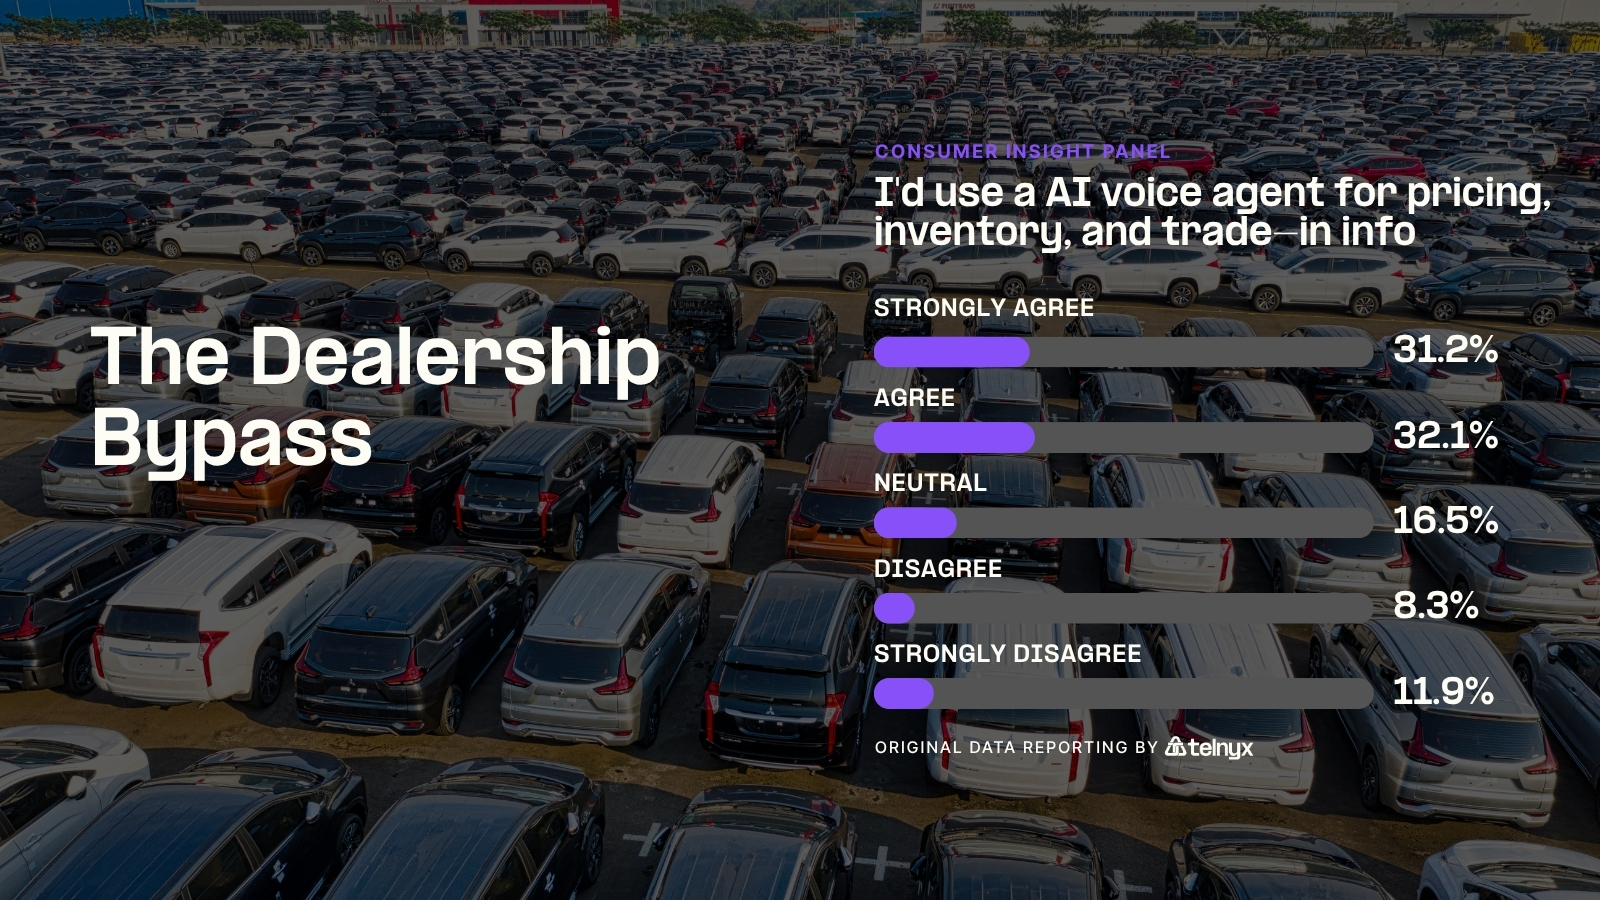
More than 6 in 10 car owners would get pricing, inventory, and trade-in information from a dealership AI voice agent instead of filling out a web form or waiting for a salesperson to call back. The preference cuts across the top of the purchase funnel: buyers want answers now, not after a form submission and a callback window. For dealerships, AI voice can capture leads at the moment of interest rather than forcing prospects into a queue.
The Service Desk Shortcut
I'd prefer AI voice for service scheduling, repair status, and maintenance reminders over waiting on hold.
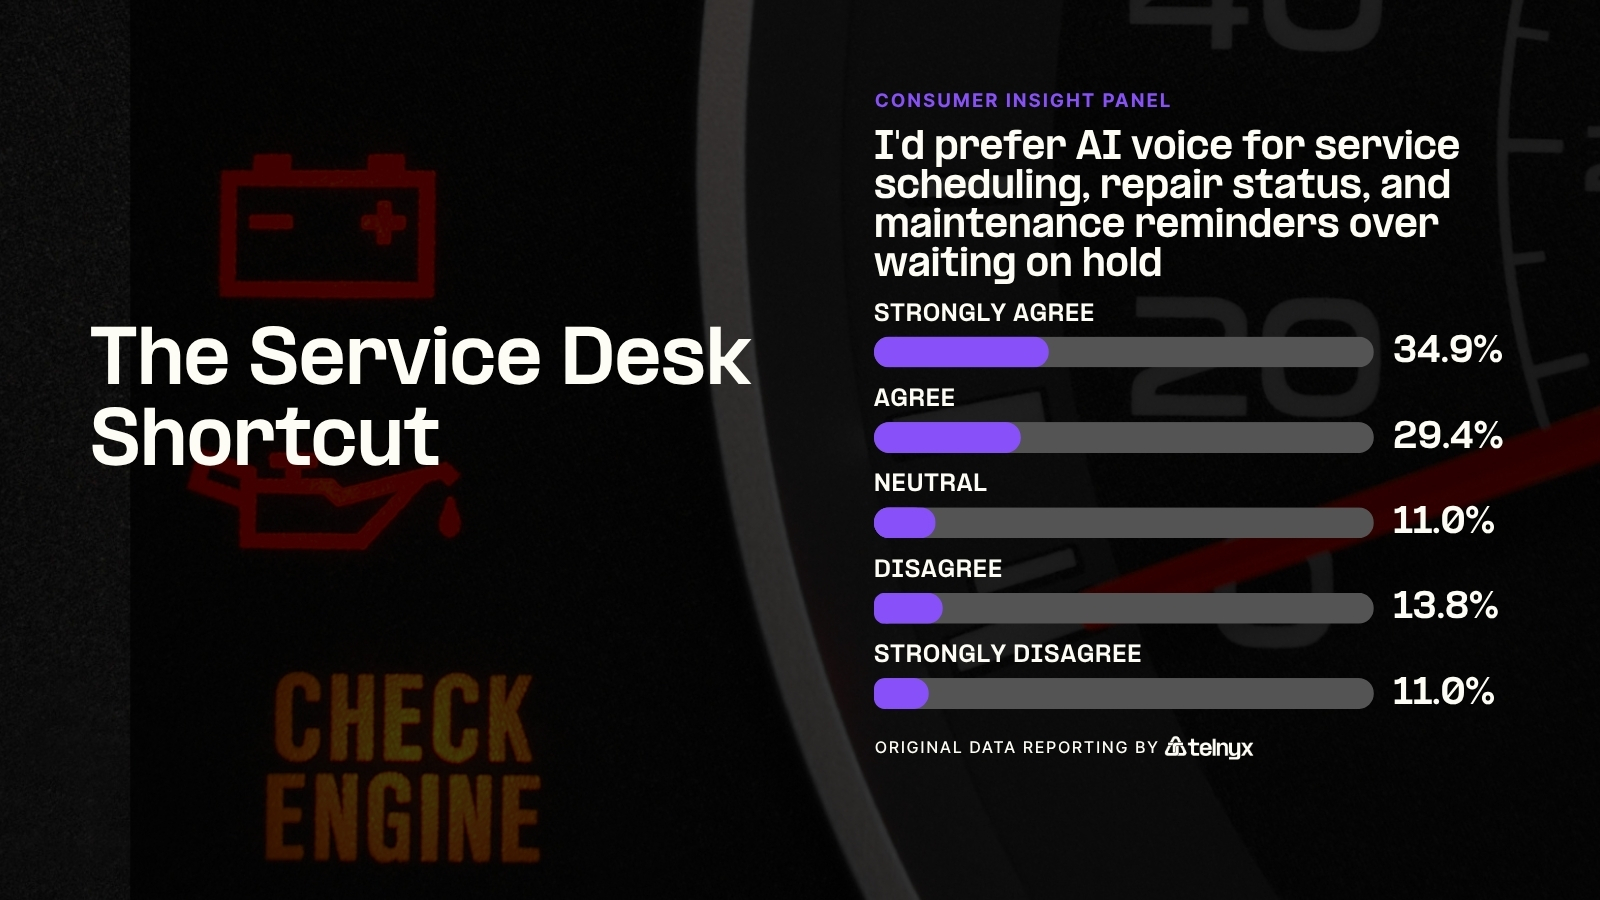
Service scheduling earned the highest agreement of any touchpoint in the survey at 64.2%. The result is intuitive: calling a service department and waiting on hold is a universally frustrating experience. AI voice removes the hold time entirely, letting car owners schedule appointments, check repair status, and get maintenance reminders through a natural conversation. For service departments running at capacity, voice AI also absorbs call volume without adding staff.
The Cabin Copilot
I'd trust an in-vehicle AI voice for navigation, calling, and vehicle controls.
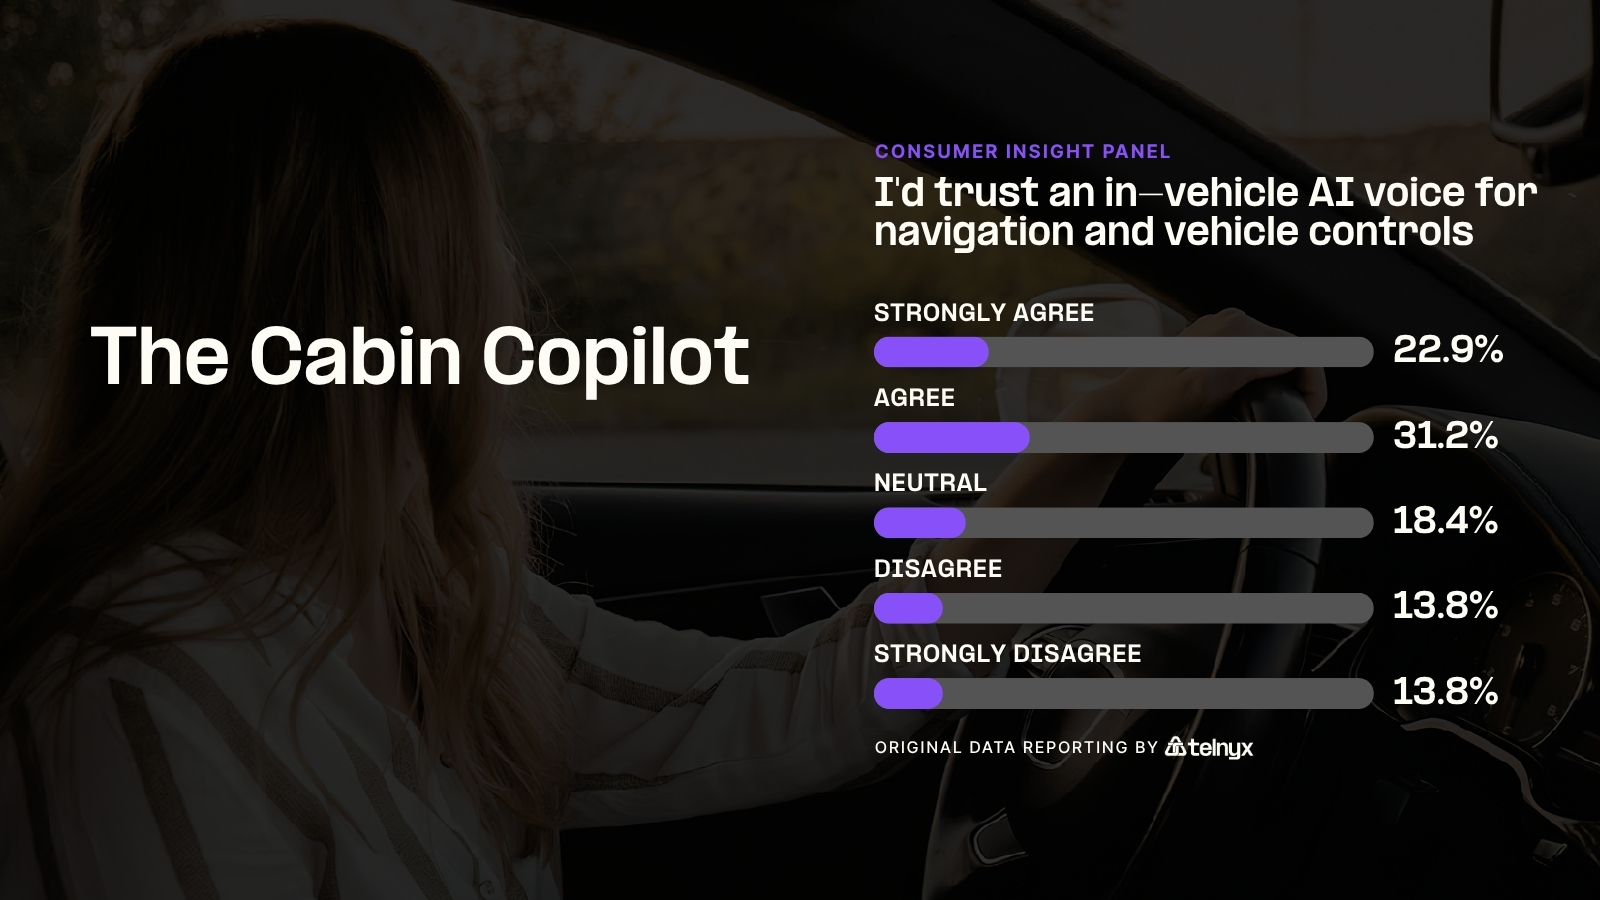
Agreement drops to 54.1% for in-vehicle AI, the first touchpoint where the interaction moves from a phone call to a physical driving context. More than half of car owners would trust AI voice for navigation, hands-free calling, and vehicle controls, but the neutral and disagree responses both climb compared to dealership and service use cases. The shift reflects a trust threshold: people are more cautious about AI when it controls something in the car, not just handles a phone interaction.
The Roadside Responder
I'd feel comfortable speaking to AI voice in a roadside emergency to dispatch help and share my location.
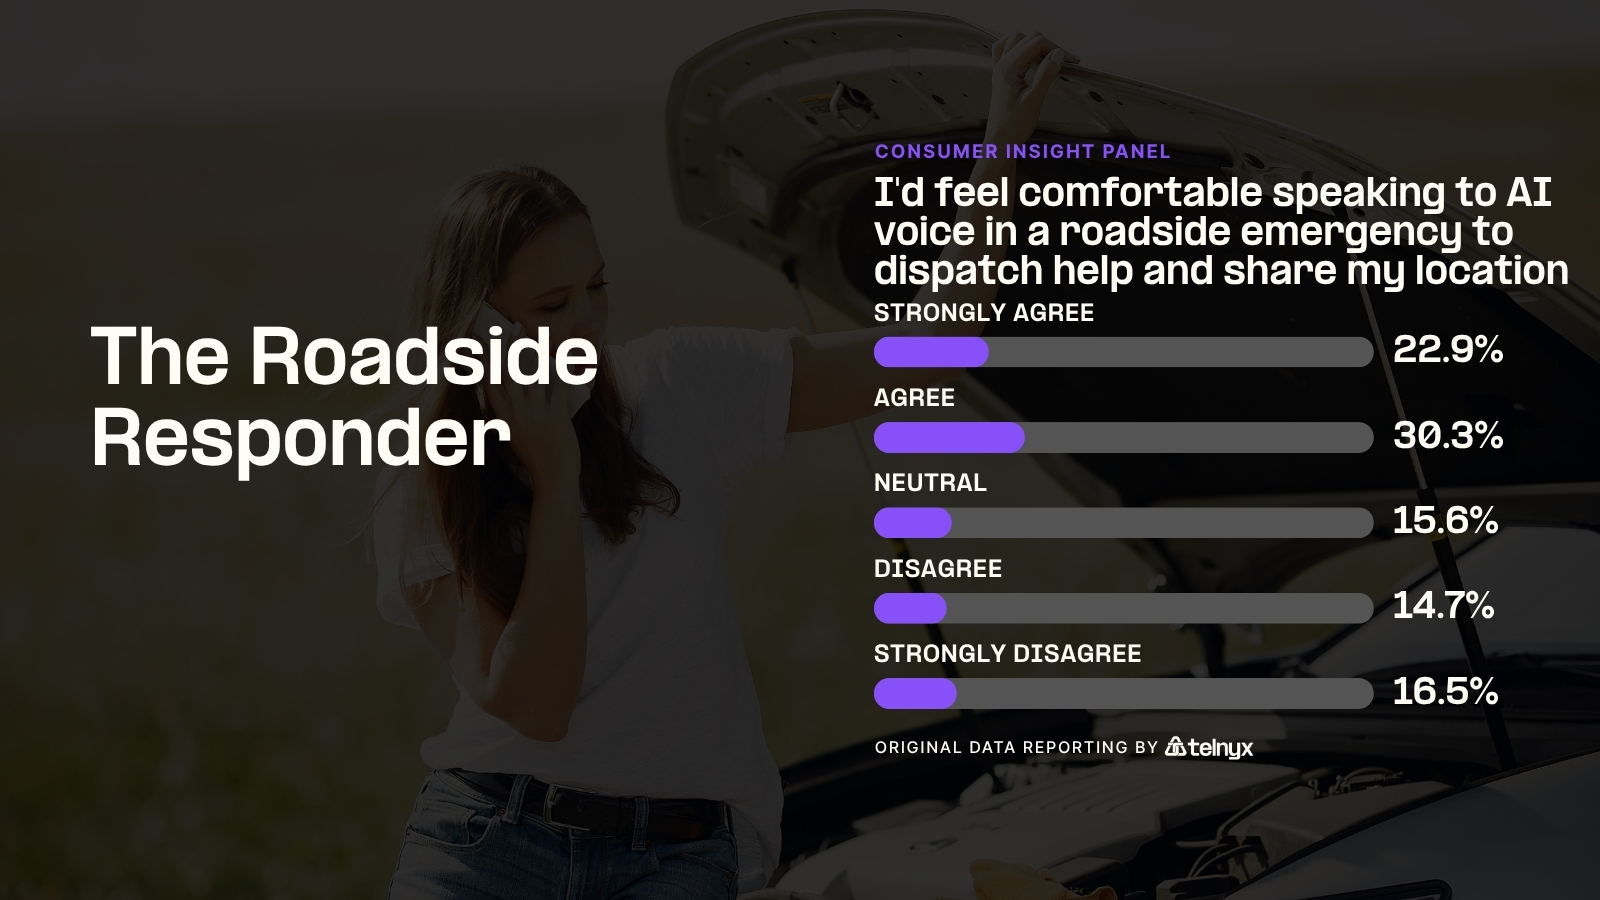
Roadside and emergency assistance hits the lowest agreement in the survey at 53.2%, and the highest combined disagreement at 31.2%. The stakes are higher: dispatching help and sharing location in a stressful situation requires confidence that the AI will understand context and act quickly. Even so, more than half would use AI voice in this scenario, suggesting that the convenience of immediate assistance outweighs skepticism for a narrow majority. For automakers and roadside assistance providers, the opportunity is real but the execution bar is higher. Carrier-grade reliability matters most here, where a dropped call has real consequences.
The Retention Call
I'd want AI voice follow-up after service to confirm satisfaction and schedule my next visit.
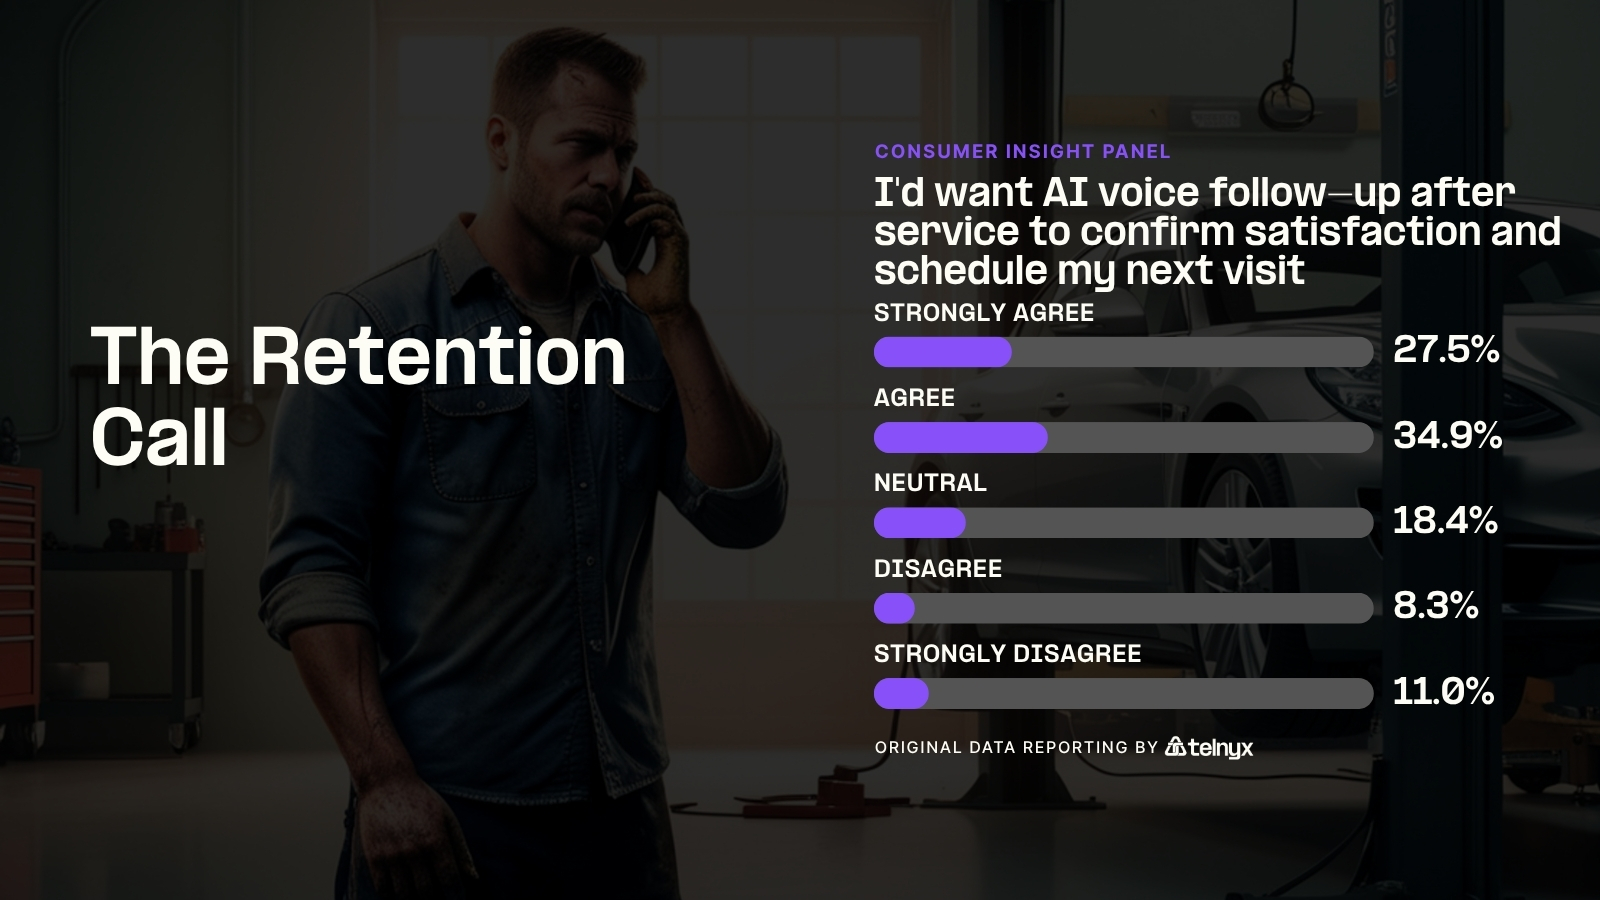
Post-service follow-up rebounds to 62.4% agreement, the second-highest after service scheduling. Car owners are comfortable with AI voice confirming that work was completed to their satisfaction and scheduling the next maintenance visit. This is a retention touchpoint that most dealerships currently skip or handle through impersonal text reminders. AI voice makes it scalable: every customer gets a follow-up call, and every call is an opportunity to book the next appointment. SMS remains a complement to voice for appointment confirmations where a written record is useful.
Key Takeaways
- Administrative tasks clear 60%+ agreement. Dealership info (63.3%), service scheduling (64.2%), and follow-up (62.4%) all show strong preference for AI voice over current channels.
- Trust drops when physical safety enters the picture. In-vehicle controls (54.1%) and emergency scenarios (53.2%) show lower agreement and higher disagreement, reflecting a trust threshold.
- The hold is the biggest enemy. Service scheduling, where the alternative is waiting on hold, earned the highest agreement of any question in the survey.
- Follow-up is an untapped retention lever. 62.4% want AI voice to check in after service, yet most dealerships skip this step entirely.
Strategic Implications
For automotive companies evaluating Voice AI, the data points to a clear deployment sequence: start with administrative and scheduling use cases where consumer preference is strongest, then expand to in-vehicle and safety-critical scenarios as trust builds. The service department is the lowest-friction entry point, and post-service follow-up is the natural next step to drive recurring revenue.
For providers building on Telnyx, the infrastructure requirements are straightforward. Low-latency voice is essential for the 64.2% who expect a conversation that feels immediate, not a delayed chatbot. Carrier-grade reliability matters most in the roadside and emergency use cases, where a dropped call has real consequences. And speech-to-text accuracy is critical when a distressed driver needs to be understood the first time.
Methodology
This survey was conducted as part of the Telnyx Consumer Insight Panel. Data was collected from 109 US adults via SurveyMonkey using a five-point Likert scale (Strongly Agree to Strongly Disagree). All questions were answered with zero skips. Results have not been weighted.
Demographic profile:
- Gender: Female 50.5%, Male 49.5%
- Region: Pacific 36.1%, South Atlantic 18.5%, East North Central 13.0%, Middle Atlantic 12.0%, Mountain 7.4%, West South Central 6.5%, East South Central 2.8%, New England 1.9%, West North Central 1.9%
- Household income: $150,000-174,999 (20.2%), $75,000-99,999 (15.6%), $175,000-199,999 (10.1%), $50,000-74,999 (10.1%), $125,000-149,999 (9.2%), $25,000-49,999 (8.3%), $100,000-124,999 (8.3%), $200,000+ (4.6%), $0-9,999 (4.6%), $10,000-24,999 (2.8%), Prefer not to answer (6.4%)
- Device: Android 63.3%, iOS 34.9%, Windows Desktop 1.8%
This survey was conducted in accordance with the AAPOR Transparency Initiative, providing full disclosure of sampling procedures, question wording, and data handling.
Share on Social