New Debugging Tools for Webhooks, TeXML, and Fax in the Mission Control Portal
31, Mar 2021
It's now easier than ever to debug your Webhooks, Programmable Fax and TeXML communications. Our new debugging tools in the Mission Control Portal allow you to search, analyze and debug your communications by inspecting webhooks associated with phone calls, faxes, messages, account events, and more.
Using these new debugging tools, you can find webhooks by webhook delivery ID, or filter a list of all recent webhook deliveries associated with your account by time, status, or text strings contained in the webhook body.
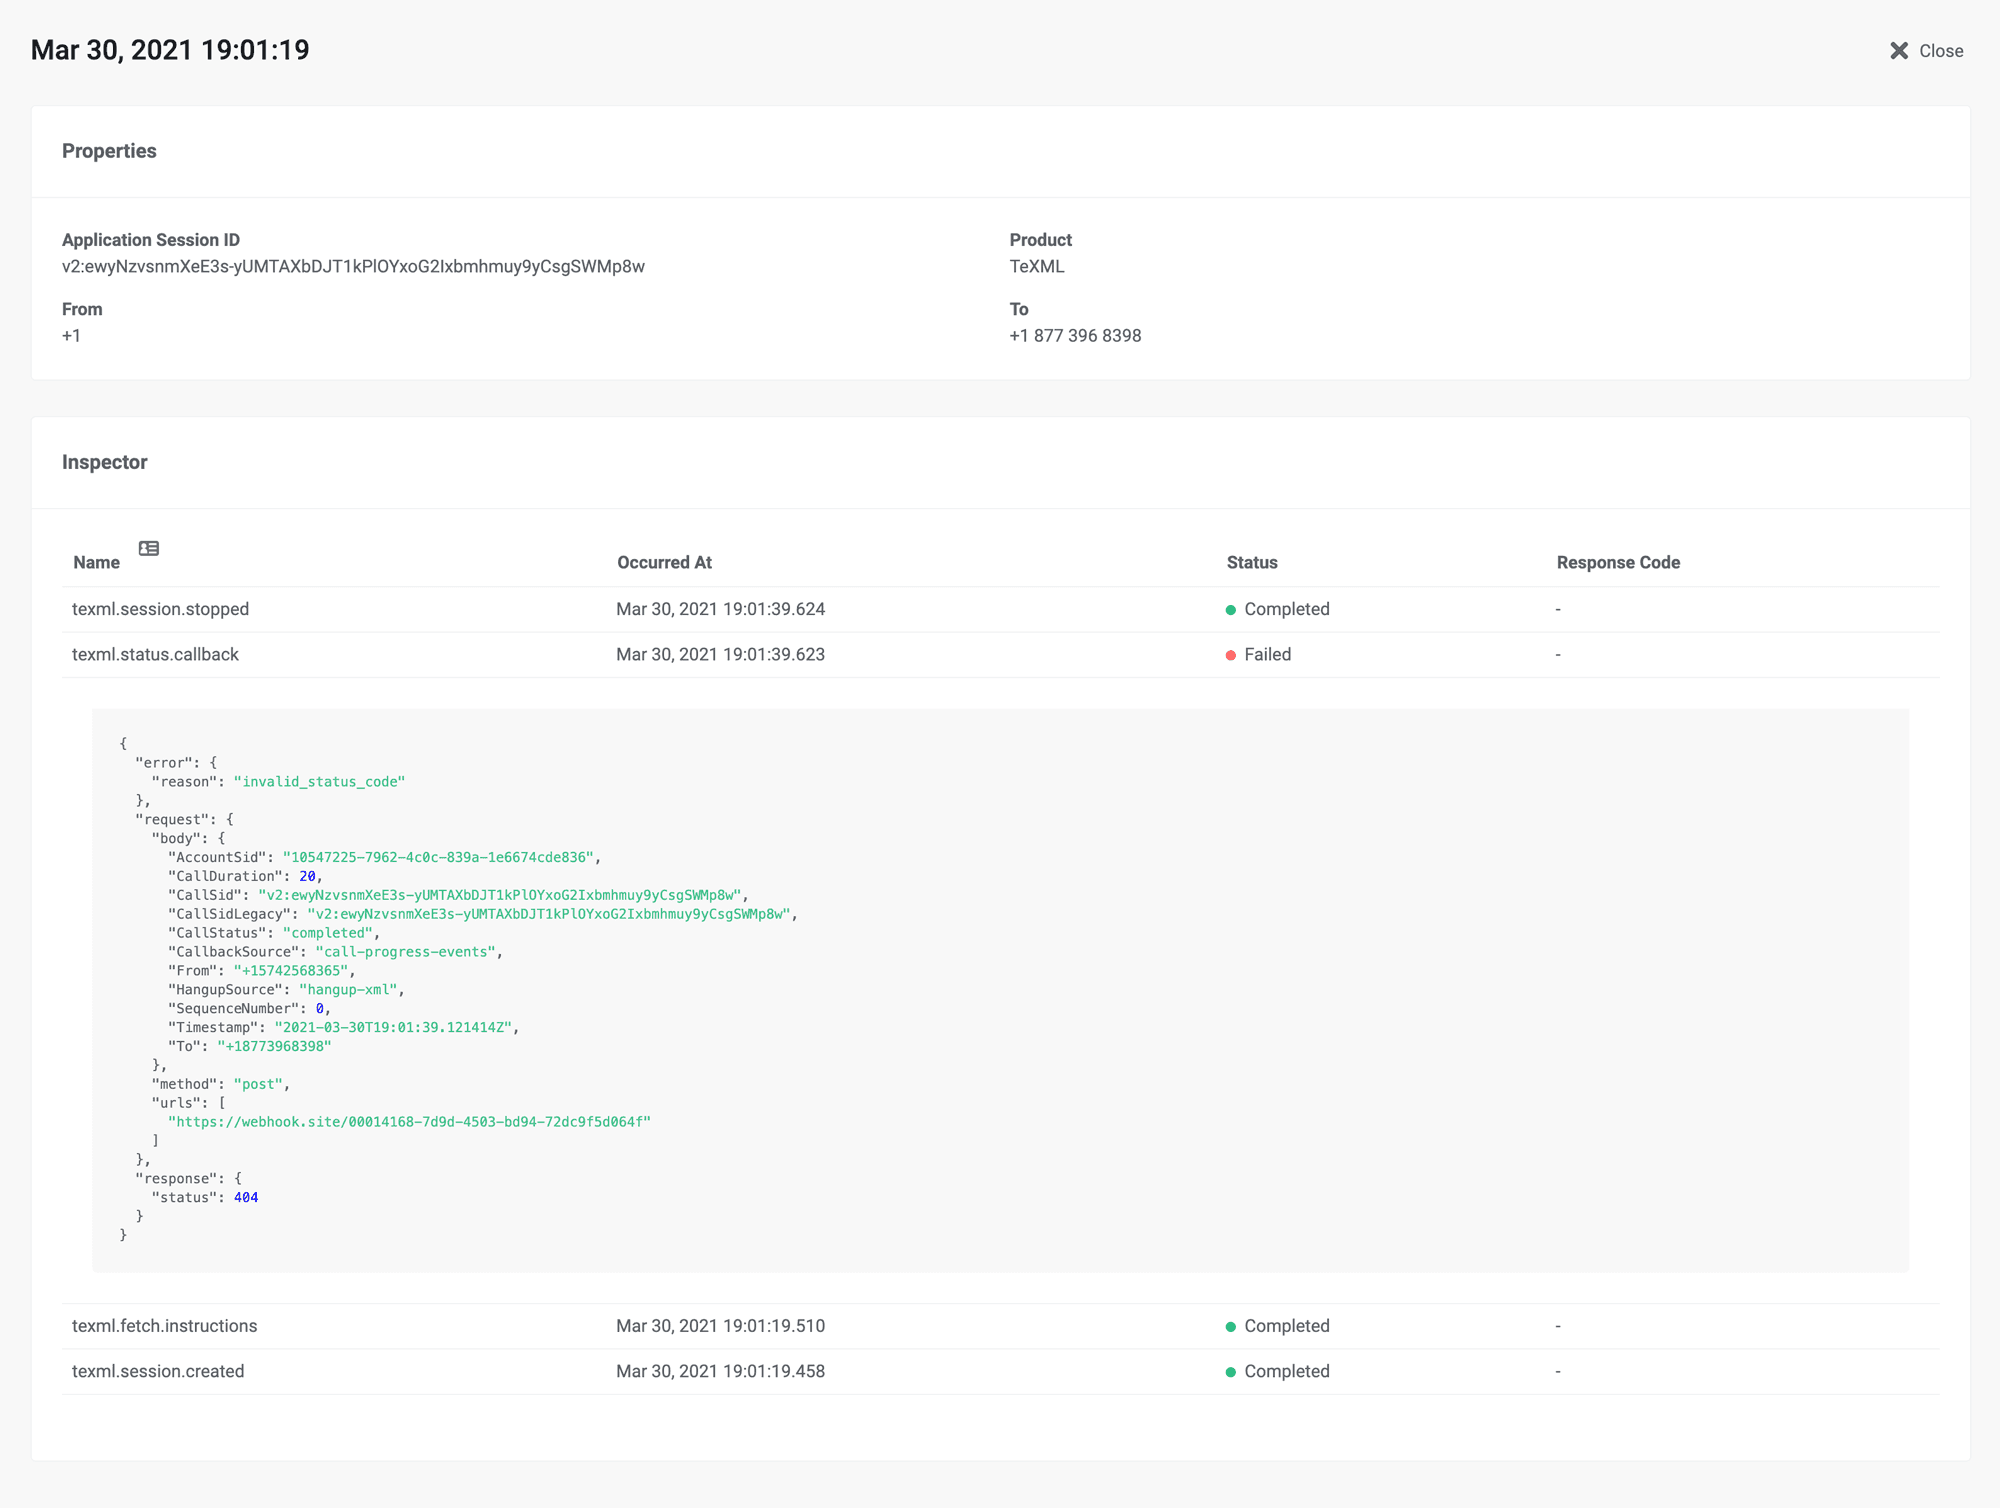
Faxes and phone calls can be found by Fax ID or Session ID, or filtered from a list of all fax and TeXML events on your account by time, product, originating number, or destination number. For each event, you can inspect the associated webhooks to see exactly when each was sent, and locate the source of any errors in your application.
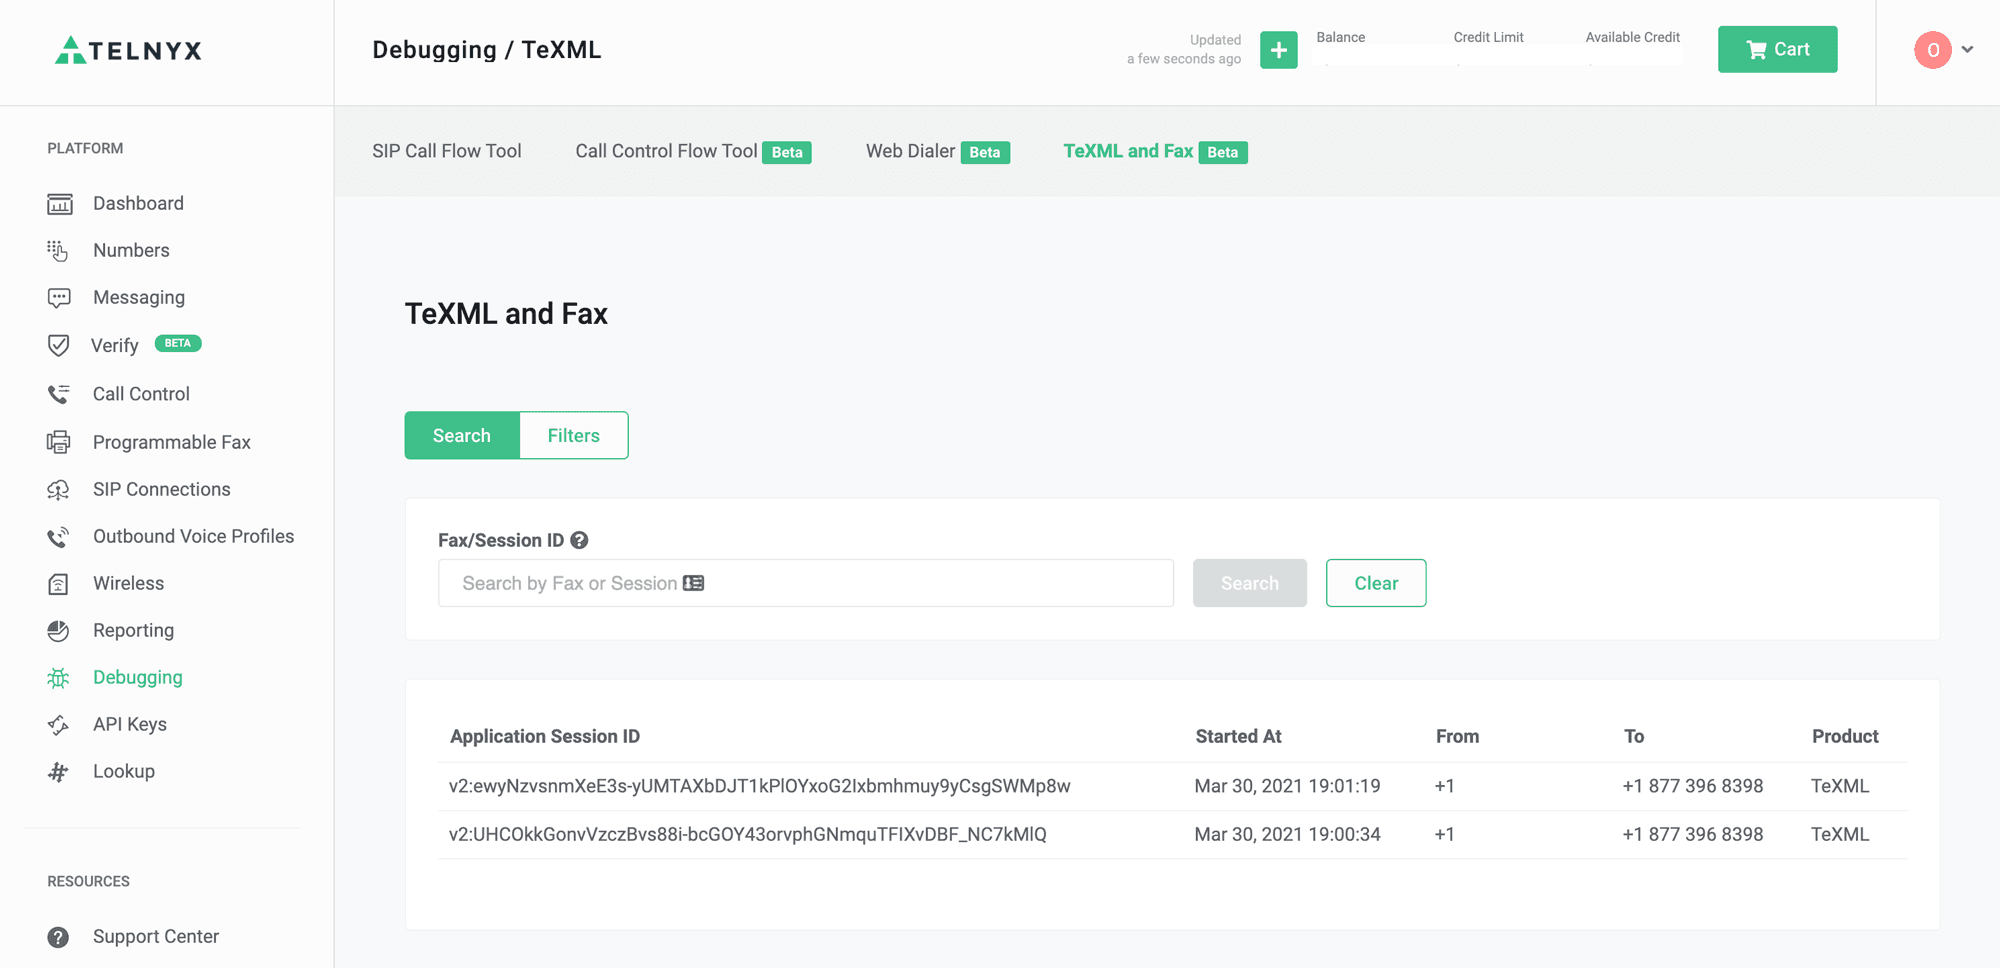
To get started using these new debugging tools for Webhooks, TeXML, and Programmable Fax, simply log into your Mission Control Portal account and browse to the Debugging tab.
Prefer to debug in your IDE? Our Webhook Logging tools allow you to extract webhooks via API with advanced filtering options.