Conversational AI
Consumer Data: 8 in 10 Choose Voice AI Over Vague Service Windows
Survey data from 107 US adults shows consumers prefer AI voice agents over web forms, vague time windows, and callback waits across every home and field service touchpoint. Live ETA trust leads at 77.6% agreement.

By Ezra Ferraz

Key findings:
- 77.6% prefer AI voice with live ETAs over a vague service window
- 63.6% want AI to dispatch help immediately in after-hours emergencies
- 60.8% would book service appointments through an AI voice agent
Book by Voice
I'd rather book a service appointment through an AI voice agent than fill out a form.
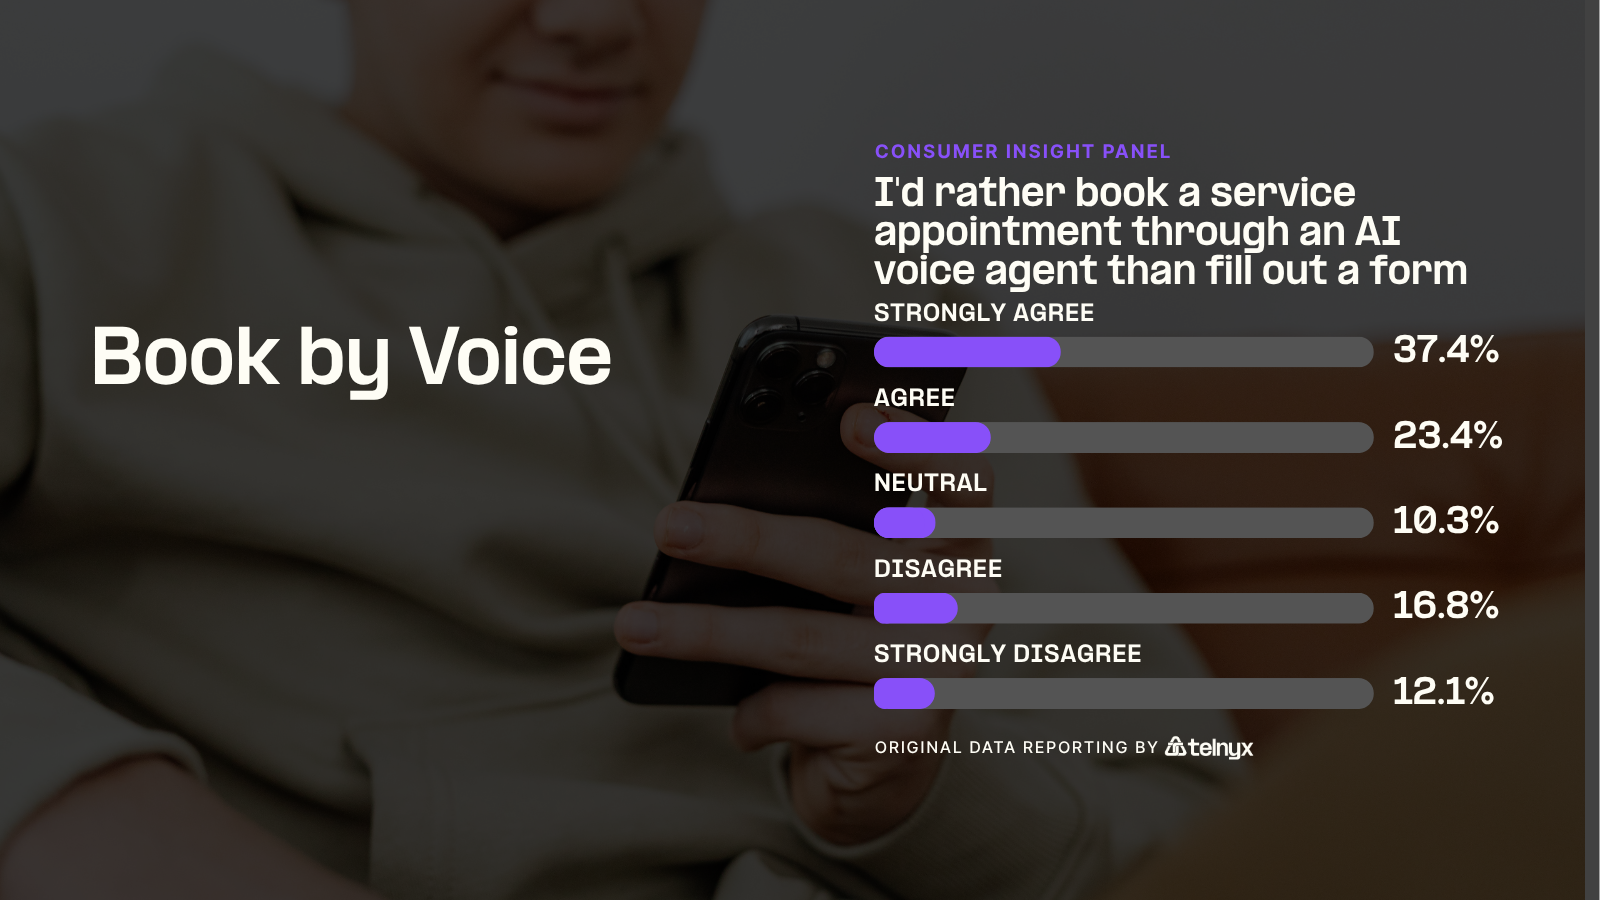
60.8% of consumers would rather book a plumbing, HVAC, electrical, or pest control appointment through an AI voice agent than fill out a web form or wait for a callback. Strong agreement (37.4%) outpaces strong disagreement (12.1%) by more than 3 to 1. The message is clear: the traditional web form is a bottleneck, and consumers are ready to talk instead of type.
Live ETA Trust
I'd trust AI giving live ETAs and on-the-fly rescheduling over a vague time window.
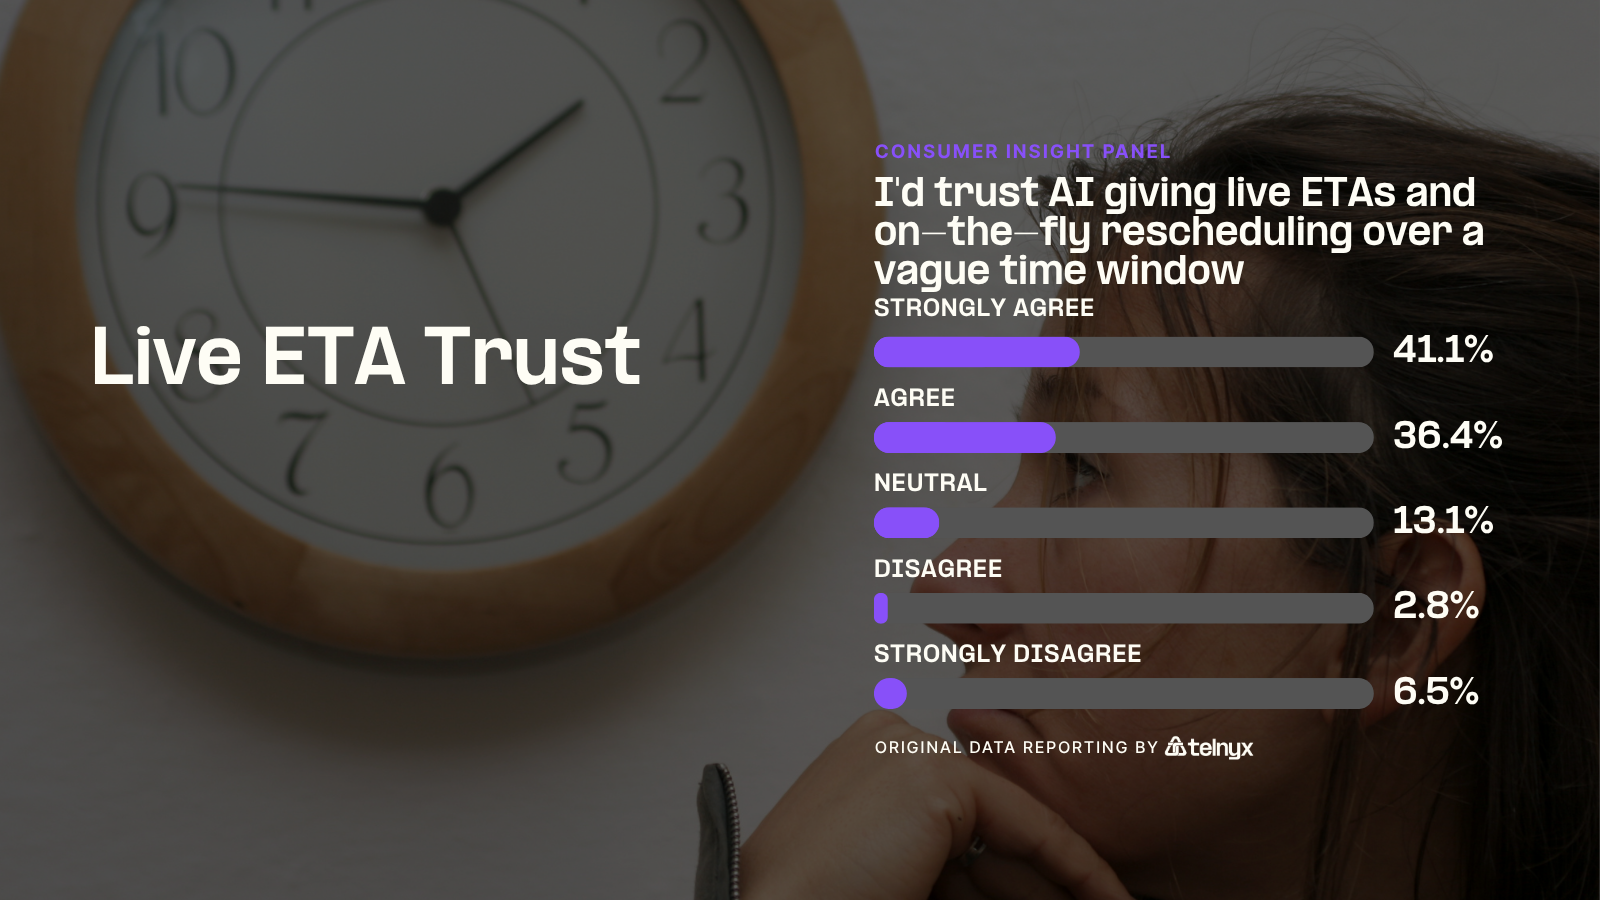
This is the standout finding of the entire survey. 77.6% agreement is the highest of any touchpoint, and only 2.8% strongly disagree. The gap between "we'll be there sometime between 8 and 12" and "your technician is 12 minutes away" is enormous. Consumers are not just open to AI voice for ETAs, they are demanding it. For field service companies, this is the lowest-hanging fruit in Voice AI deployment.
Pre-Visit Context
I'd describe my problem to AI so the tech shows up with the right parts.
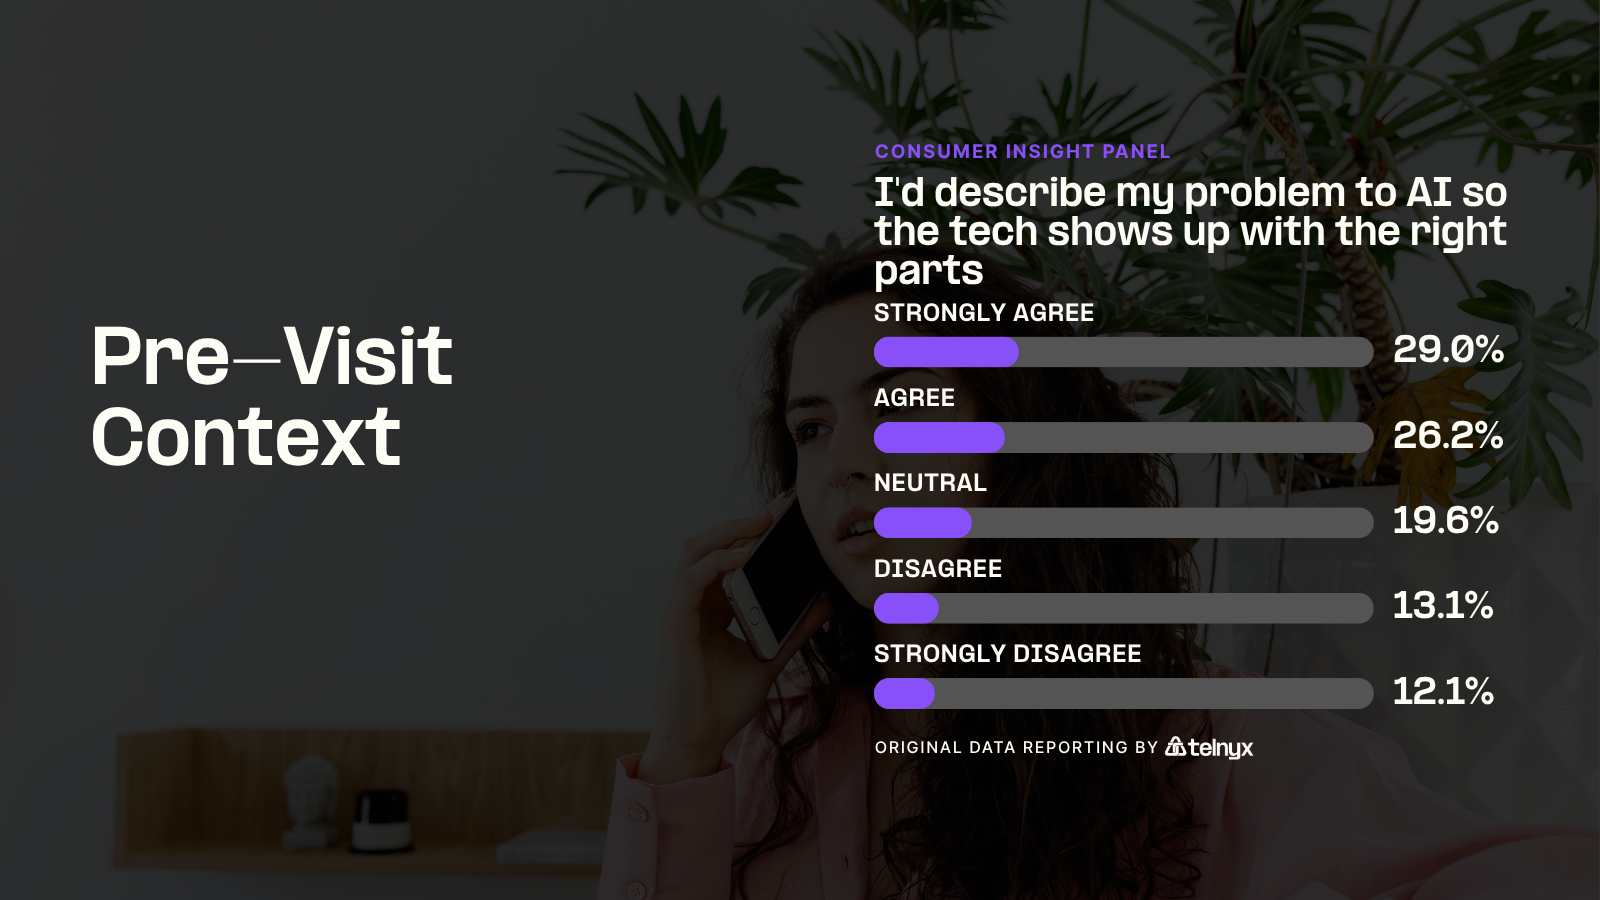
Agreement drops to 55.1% here, the lowest of the five touchpoints. Describing a problem to AI requires more trust than receiving an ETA. Still, more consumers agree than disagree, and the 19.6% neutral group represents an opportunity. If the AI proves competent at understanding technical descriptions, that neutral camp moves quickly toward agreement. First-call resolution rates improve when technicians arrive prepared, making this a high-ROI deployment once confidence is established.
Emergency Dispatch
I'd rather talk to AI that dispatches help immediately than wait for a callback.
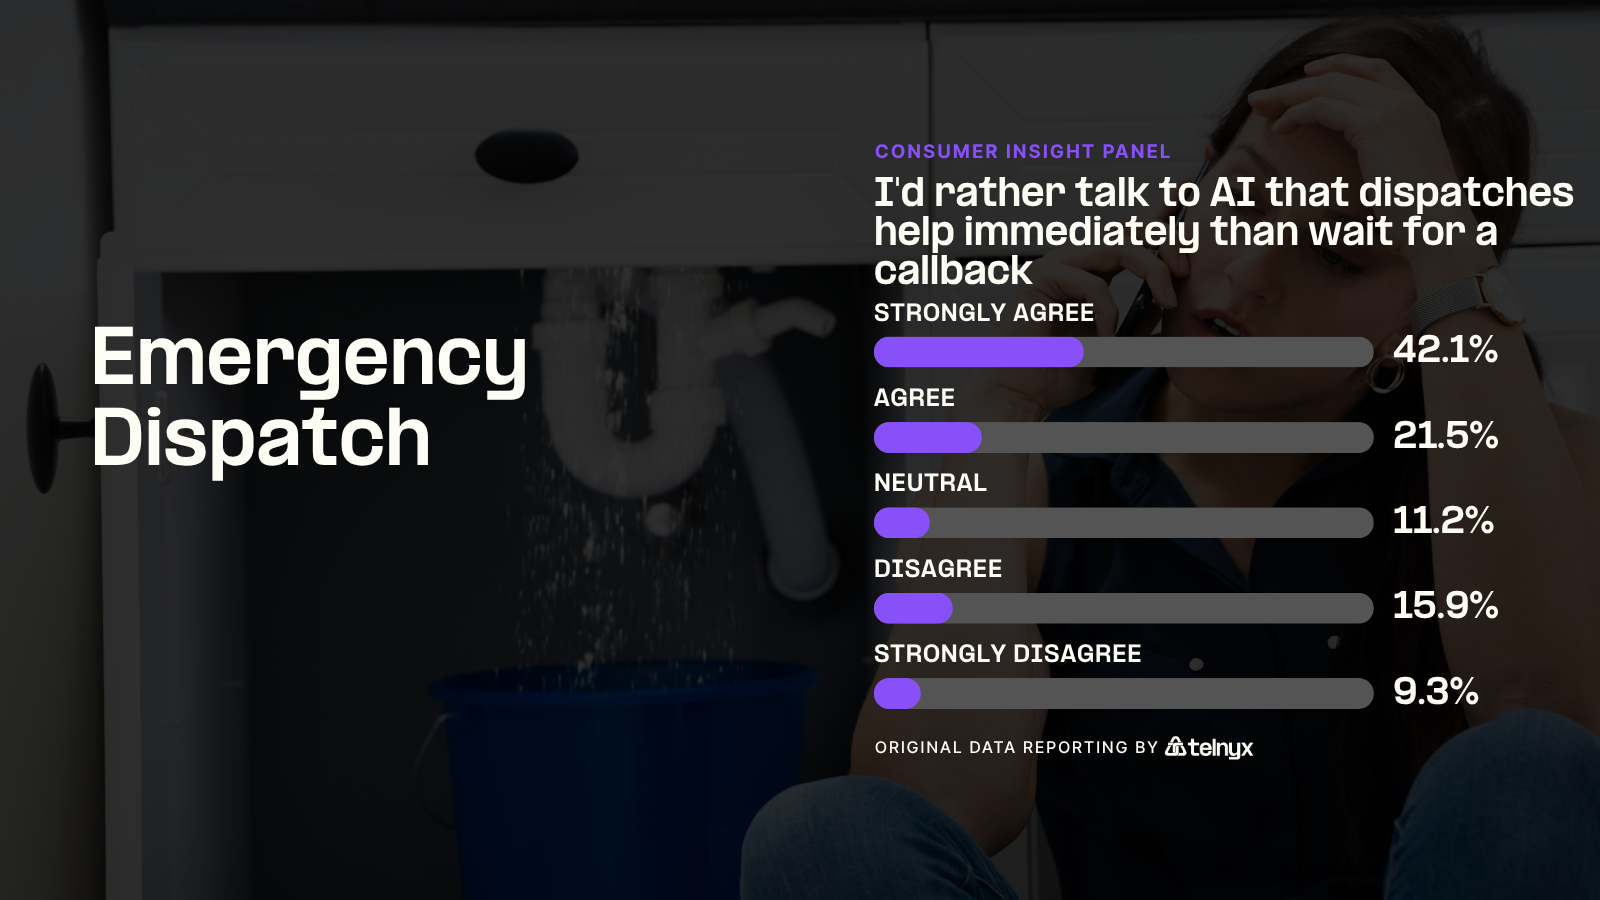
63.6% want AI voice that can dispatch help immediately in after-hours emergencies like a burst pipe, no heat, or a lockout. Strong agreement leads at 42.1%, the second-highest in the survey. The urgency is the driver: when something breaks at 11 PM, a callback in the morning is not a solution. AI voice agents that can triage, dispatch, and confirm help is on the way fill a gap that on-call humans cannot.
Post-Service Follow-Up
I'd appreciate an AI follow-up confirming the work, handling payment, and scheduling maintenance.
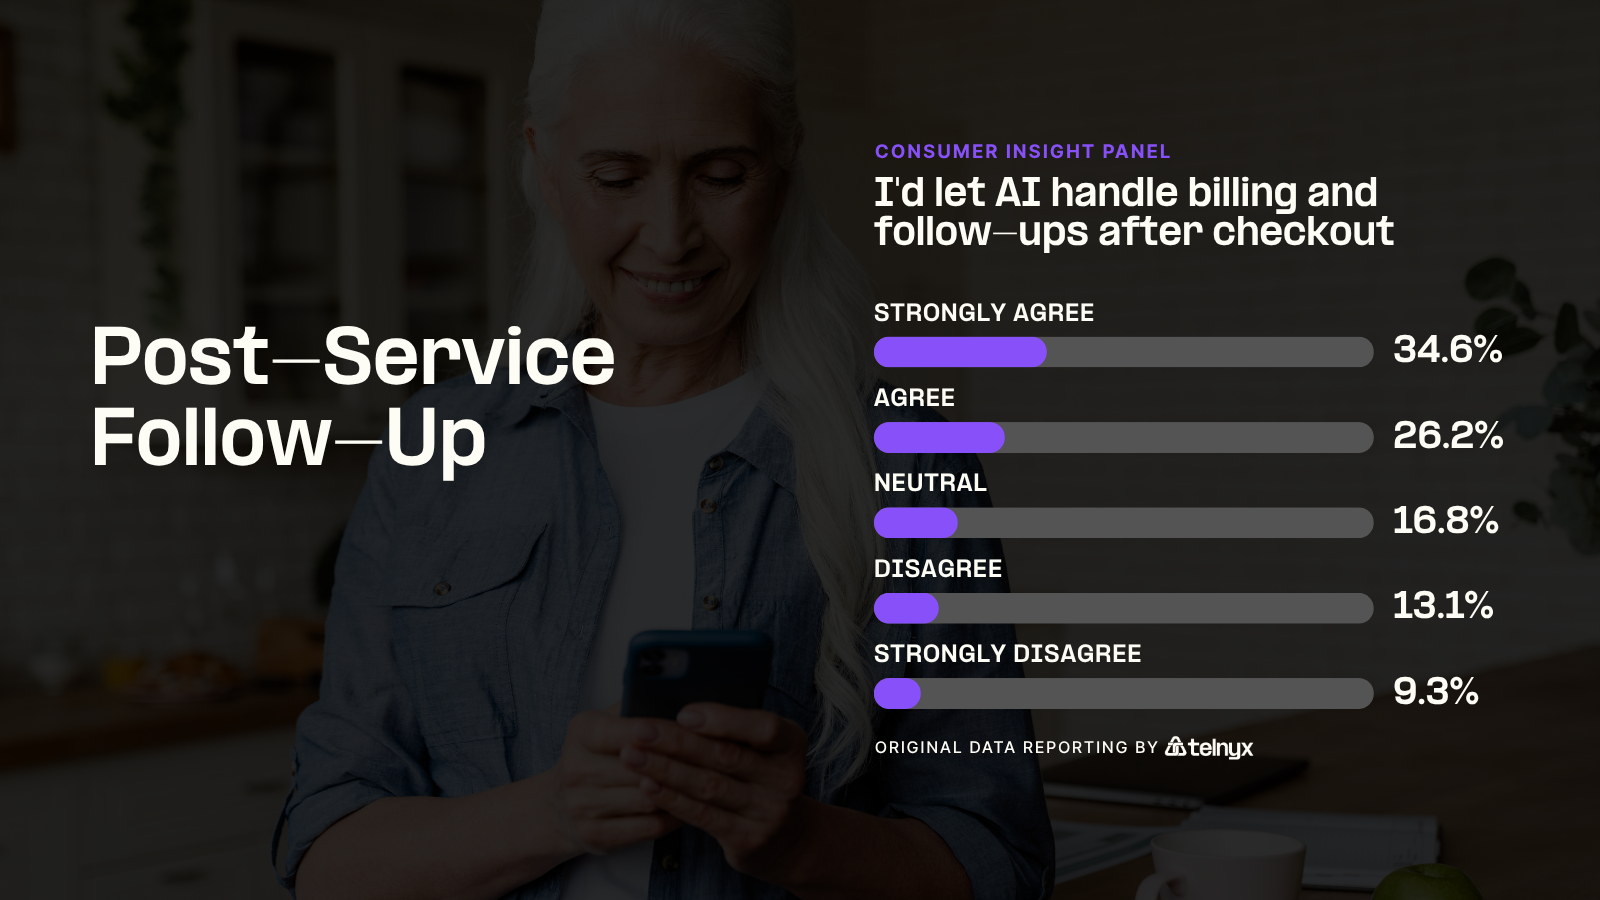
60.8% are open to AI voice handling post-service follow-up, including confirming the work was done right, handling payment or warranty questions, and scheduling routine maintenance. Combined with the booking finding, this means AI voice bookends the service experience well. The middle touchpoints (context sharing, emergency dispatch) require more trust, but the entry and exit points are low resistance. Companies deploying Voice AI should start at the edges of the journey and work inward.
Key Takeaways
- Live ETAs are the killer use case. 77.6% agreement with only 2.8% strong disagreement. No other touchpoint comes close.
- Uncertainty drives preference more than convenience. The touchpoint that replaces the most uncertainty (Live ETA Trust) scores 22 points higher than the one that requires the most trust (Pre-Visit Context).
- AI voice bookends the service journey. Booking (60.8%) and follow-up (60.8%) both clear 60%. Start deployment at the edges and work inward.
- Emergency dispatch is a sleeper use case. 42.1% strong agreement, second only to Live ETAs. After-hours urgency makes AI voice not just preferred but necessary.
Strategic Implications
For home and field service companies evaluating Voice AI, the deployment sequence is clear:
- Start with live ETAs and rescheduling. This is the highest-demand, lowest-resistance entry point. Consumers are not just willing, they are asking for it.
- Add booking and follow-up automation. These bookend the service journey and both clear 60% agreement. They also reduce administrative overhead on dispatch teams.
- Expand into emergency dispatch. The strong agreement is there, especially for after-hours scenarios. Pair AI voice with your existing on-call rotation for immediate triage.
- Layer in pre-visit context collection last. This requires the most consumer trust but delivers the highest operational value once adopted. Start with structured prompts ("Is the issue heating, cooling, plumbing, or electrical?") before opening to free-form descriptions.
Across every touchpoint, more consumers agree than disagree. The question is not whether to deploy, but where to start.
Methodology
This survey was conducted as part of the Telnyx Consumer Insight Panel. Data was collected from 107 US adults via SurveyMonkey using a 5-point Likert scale (Strongly Agree to Strongly Disagree). All respondents answered every question with zero skips. The survey was fielded in May 2026. Percentages are reported to the tenths place without rounding. Results have not been weighted.
Demographic profile:
- Gender: Female 48.6%, Male 51.4%
- Region: Pacific 27.6%, South Atlantic 21.0%, Middle Atlantic 15.2%, Mountain 14.3%, East North Central 9.5%, West South Central 4.8%, East South Central 2.9%, West North Central 2.9%, New England 1.9%
- Household income: $125,000-149,999 (17.8%), $175,000-199,999 (15.0%), $75,000-99,999 (15.9%), $150,000-174,999 (14.0%), $25,000-49,999 (15.0%), $100,000-124,999 (3.7%), $10,000-24,999 (4.7%), $0-9,999 (2.8%), $50,000-74,999 (2.8%), $200,000+ (2.8%), Prefer not to answer (5.6%)
- Device: Android 67.3%, iOS 30.8%, Windows Desktop 0.9%, MacOS 0.9%
- Age: 45-60 (43.0%), 30-44 (38.3%), 18-29 (9.3%), 60+ (9.3%)
This survey was conducted in accordance with the AAPOR Transparency Initiative, providing full disclosure of sampling procedures, question wording, and data handling.
Share on Social