SIP Trunking
Check SIP Issues Using Wireshark, TCPDUMP and TShark
Signalling is the most important step for establishing a connection. Use this to interrogate SIP signalling to troubleshoot issues
By Sara Weichhand
Troubleshooting SIP issues using Wireshark, tcpdump, and tshark
VoIP communications, from a business point of view, is an interesting alternative to standard telephony. It allows you to scale and deploy your telecommunications infrastructure as needed, thus allowing you to save major long-term costs.
From a technical point of view, this alternative can be daunting and challenging since it involves the management of your network, the connectivity with many devices outside of your network (in other words, out of your control), the knowledge of many protocols and the appropriate tools to troubleshoot.
This article focuses on troubleshooting SIP trunks by interrogating the Session Initiation Protocol (SIP) signaling, as signaling is the most important step for establishing a connection between your switch and the person you are trying to reach.
Whether you're building a programmable Voice API application or running enterprise-grade SIP infrastructure, understanding how to capture and analyze SIP traffic is essential for maintaining reliable communications.
Understanding SIP response codes
The SIP Protocol is in charge of negotiating the signaling between point A and point B. There are a few SIP codes we need to know in order to understand how/what to troubleshoot.
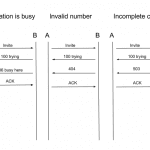
Figure 1.1: Common SIP response code scenarios
| Scenario | SIP Response | Meaning |
|---|---|---|
| Successful call setup | 100 Trying → 180 Ringing → 200 OK | Call established normally |
| Call declined | 603 Decline | Remote party rejected the call |
| User busy | 486 Busy Here | Destination is currently occupied |
| Authentication failure | 401/403 | Credentials invalid or unauthorized |
| Not found | 404 Not Found | Destination does not exist |
| Server error | 5xx codes | Server-side issue requiring escalation |
For a complete reference of SIP response codes and their meanings, see the Telnyx SIP response codes guide.
Packet capture tools overview
Now that we have the most common scenarios described, we need to find these messages on our switch. There are a number of open-source tools available to capture SIP messages (tcpdump, tshark) and analyze them (Wireshark). These can be installed based on the OS your switch is operating on. A simple web search will provide you with the right links, furthermore, below are some links that worked for us:
- tcpdump for Linux
- tcpdump for Windows
- tshark for Linux
- tshark for Windows
- Wireshark for Linux
- Wireshark for Windows
Choosing the right tool for the job
| Filter/Use Case | tcpdump | tshark | Wireshark |
|---|---|---|---|
| Quick real-time capture on remote server | ✓ Best | ✓ Good | Not suitable |
| Filter by SIP method (INVITE, BYE, etc.) | Limited | ✓ Best | ✓ Best |
| Filter by Call-ID | Not supported | ✓ Full support | ✓ Full support |
| View call flow diagrams | Not supported | Not supported | ✓ Best |
| Export PCAP for later analysis | ✓ Full support | ✓ Full support | ✓ Full support |
| Filter by SIP response code | Limited | ✓ Full support | ✓ Full support |
| RTP/audio analysis | Capture only | Basic | ✓ Best |
| Low resource usage | ✓ Best | ✓ Good | High resources |
Expert advice on SIP capture best practices
"If the packets we need are not available for us to investigate when we need them, we're in trouble. Regardless of title or experience, a good voice engineer should be prepared to do whatever conditions dictate to capture voice packets needed to get the job done. tcpdump familiarity is definitely not optional—when everything else fails, this good old friend won't let you down."
— Lorenzo Mangani, Co-founder, QXIP and Creator of HOMER SIP Capture (sipcapture.org)
Example 1: Customer can't connect any calls
Issue
Customer can't connect any call at all.
Analysis
If other customers are having the same issue, then you have an issue with your switch. If this is the only customer experiencing this issue, then you can check the following:
- Ping your customer's IP to make sure connectivity is up
- Run a tshark command to see if your server is rejecting traffic
Where:
-irepresents your internet interface (for the example we are using wlan0)portrepresents the traffic you are capturing (5060 is SIP)hostrepresents the IP you are trying to capture
For more tshark filter examples, see the tshark tutorial and filter examples.
With the tshark command, you will be able to see the SIP negotiation in real-time and determine the root cause of the issue based on the SIP response codes.
Common tshark commands and expected output
| Command | Purpose | Expected Output |
|---|---|---|
tshark -i eth0 -f "port 5060" | Capture all SIP traffic | Real-time packet summary showing INVITE, ACK, BYE messages |
tshark -i eth0 -f "port 5060" -V | Verbose SIP packet details | Full SIP headers including From, To, Call-ID, Via |
tshark -i eth0 -Y "sip.Method==INVITE" | Filter only INVITE requests | Only displays call initiation attempts |
tshark -i eth0 -Y "sip.Status-Code >= 400" | Filter error responses | Shows 4xx/5xx errors (403 Forbidden, 404 Not Found, etc.) |
tshark -i eth0 -Y "sip.Call-ID==abc123" | Filter specific call by Call-ID | All packets for a single SIP dialog |
tshark -i eth0 -w capture.pcap port 5060 | Save capture to file | Creates PCAP file for Wireshark analysis |
tshark -r capture.pcap -Y "sip" | Read from saved PCAP | Displays SIP packets from saved file |
tshark -i eth0 -T fields -e sip.Call-ID -e sip.Status-Code | Extract specific fields | Tab-separated Call-ID and response codes |
Example 2: Customer has issues with dropped calls
Issue
Customer has issues with dropped calls.
Analysis
It is necessary to know which end sent the BYE message on the SIP codes. If this is a constant issue you would need to run a trace on your customer's IP, so you can retrieve a PCAP file and analyze it on Wireshark.
Run the tcpdump command:
Where:
-irepresents your internet interface (for the example we are using eth1)-wwrites the capture to a fileportrepresents the traffic you are capturing (5060 is SIP)hostrepresents the IP you are trying to capture
Once the trace is completed, open the PCAP file in Wireshark and analyze SIP signaling to find out where the BYE message came from. Based on your findings you can either escalate with your VoIP service provider or let the customer know that the issue is not on your end.
For detailed guidance on interpreting call quality metrics and SIP ladder diagrams, see our guide on call insights and metrics.
Using Telnyx debugging tools
Telnyx provides built-in debugging tools through the Mission Control Portal that complement these packet capture techniques. The Telnyx debugging tools allow you to:
- View SIP call flows with detailed data for each SIP request
- Check QoS statistics including MOS scores, jitter, and packet loss
- Monitor webhook deliveries for Call Control applications
- Export PCAP data for sharing with your team
For step-by-step troubleshooting guidance, see Troubleshooting call completion.
Additional resources
Understanding SIP fundamentals
- SIP vs VoIP: Key differences explained
- SIP meaning and SIP terms explained
- SIP response codes: All you need to know
- What is SIP trunking?
Advanced SIP debugging
Developer documentation
Industry solutions
If you're building voice applications for specific industries, explore our solution guides:
Conclusion
Troubleshooting SIP with signaling relies on your ability to capture the information needed to find a root cause of the issue and also your ability to interpret the results of the packet capture. It is always good practice to try to recreate the issues, as most of the time the situations can be replicated.
As far as the tools go, there are more sophisticated ones available, but the ones you really need are free and will get you most of the way there with troubleshooting production traffic to find the root cause.
For enterprise-grade SIP trunking with built-in debugging tools and 24/7 support, explore Telnyx SIP trunks or sign up to get started.
Troubleshooting SIP with Wireshark or tcpdump? Join our subreddit.
Share on Social