

Inference benchmarks only predict your latency when they match your traffic. Learn which metric fits your workload, then run your own tail-latency check in an afternoon.
Takeaways
- Inference benchmarks predict your latency only when their traffic shape, load, and tail match yours, and you can test that yourself in an afternoon.
- MLPerf, InferenceX, consumer GPU reviews, and local runtimes each answer a different question.
- A throughput number means little until you know how fast each user gets served.
- Telnyx’s published results all come from its Default tier, and the other tiers trade speed for price on the same model.
What do inference benchmarks measure?
Inference benchmarks measure how quickly and how consistently a serving stack answers requests when it's under load. Inference is the moment a trained model does its job: you send a prompt, and it sends tokens back. A benchmark grades the hardware and software doing that work, while a quality leaderboard grades the model itself.
If you run agents on a closed model today and you're weighing open-weight options, you've probably been shown a slide with one big tokens-per-second number. Here's how to work out what that number is worth to you. One reference point before we start: the Telnyx Inference API runs open-weight models on GPUs Telnyx owns in the Americas, Europe, MENA, and APAC, and every benchmark Telnyx publishes refers to its Default tier. Its Priority and Flex tiers move the serving point without changing the model, and you'll see why that matters further down.
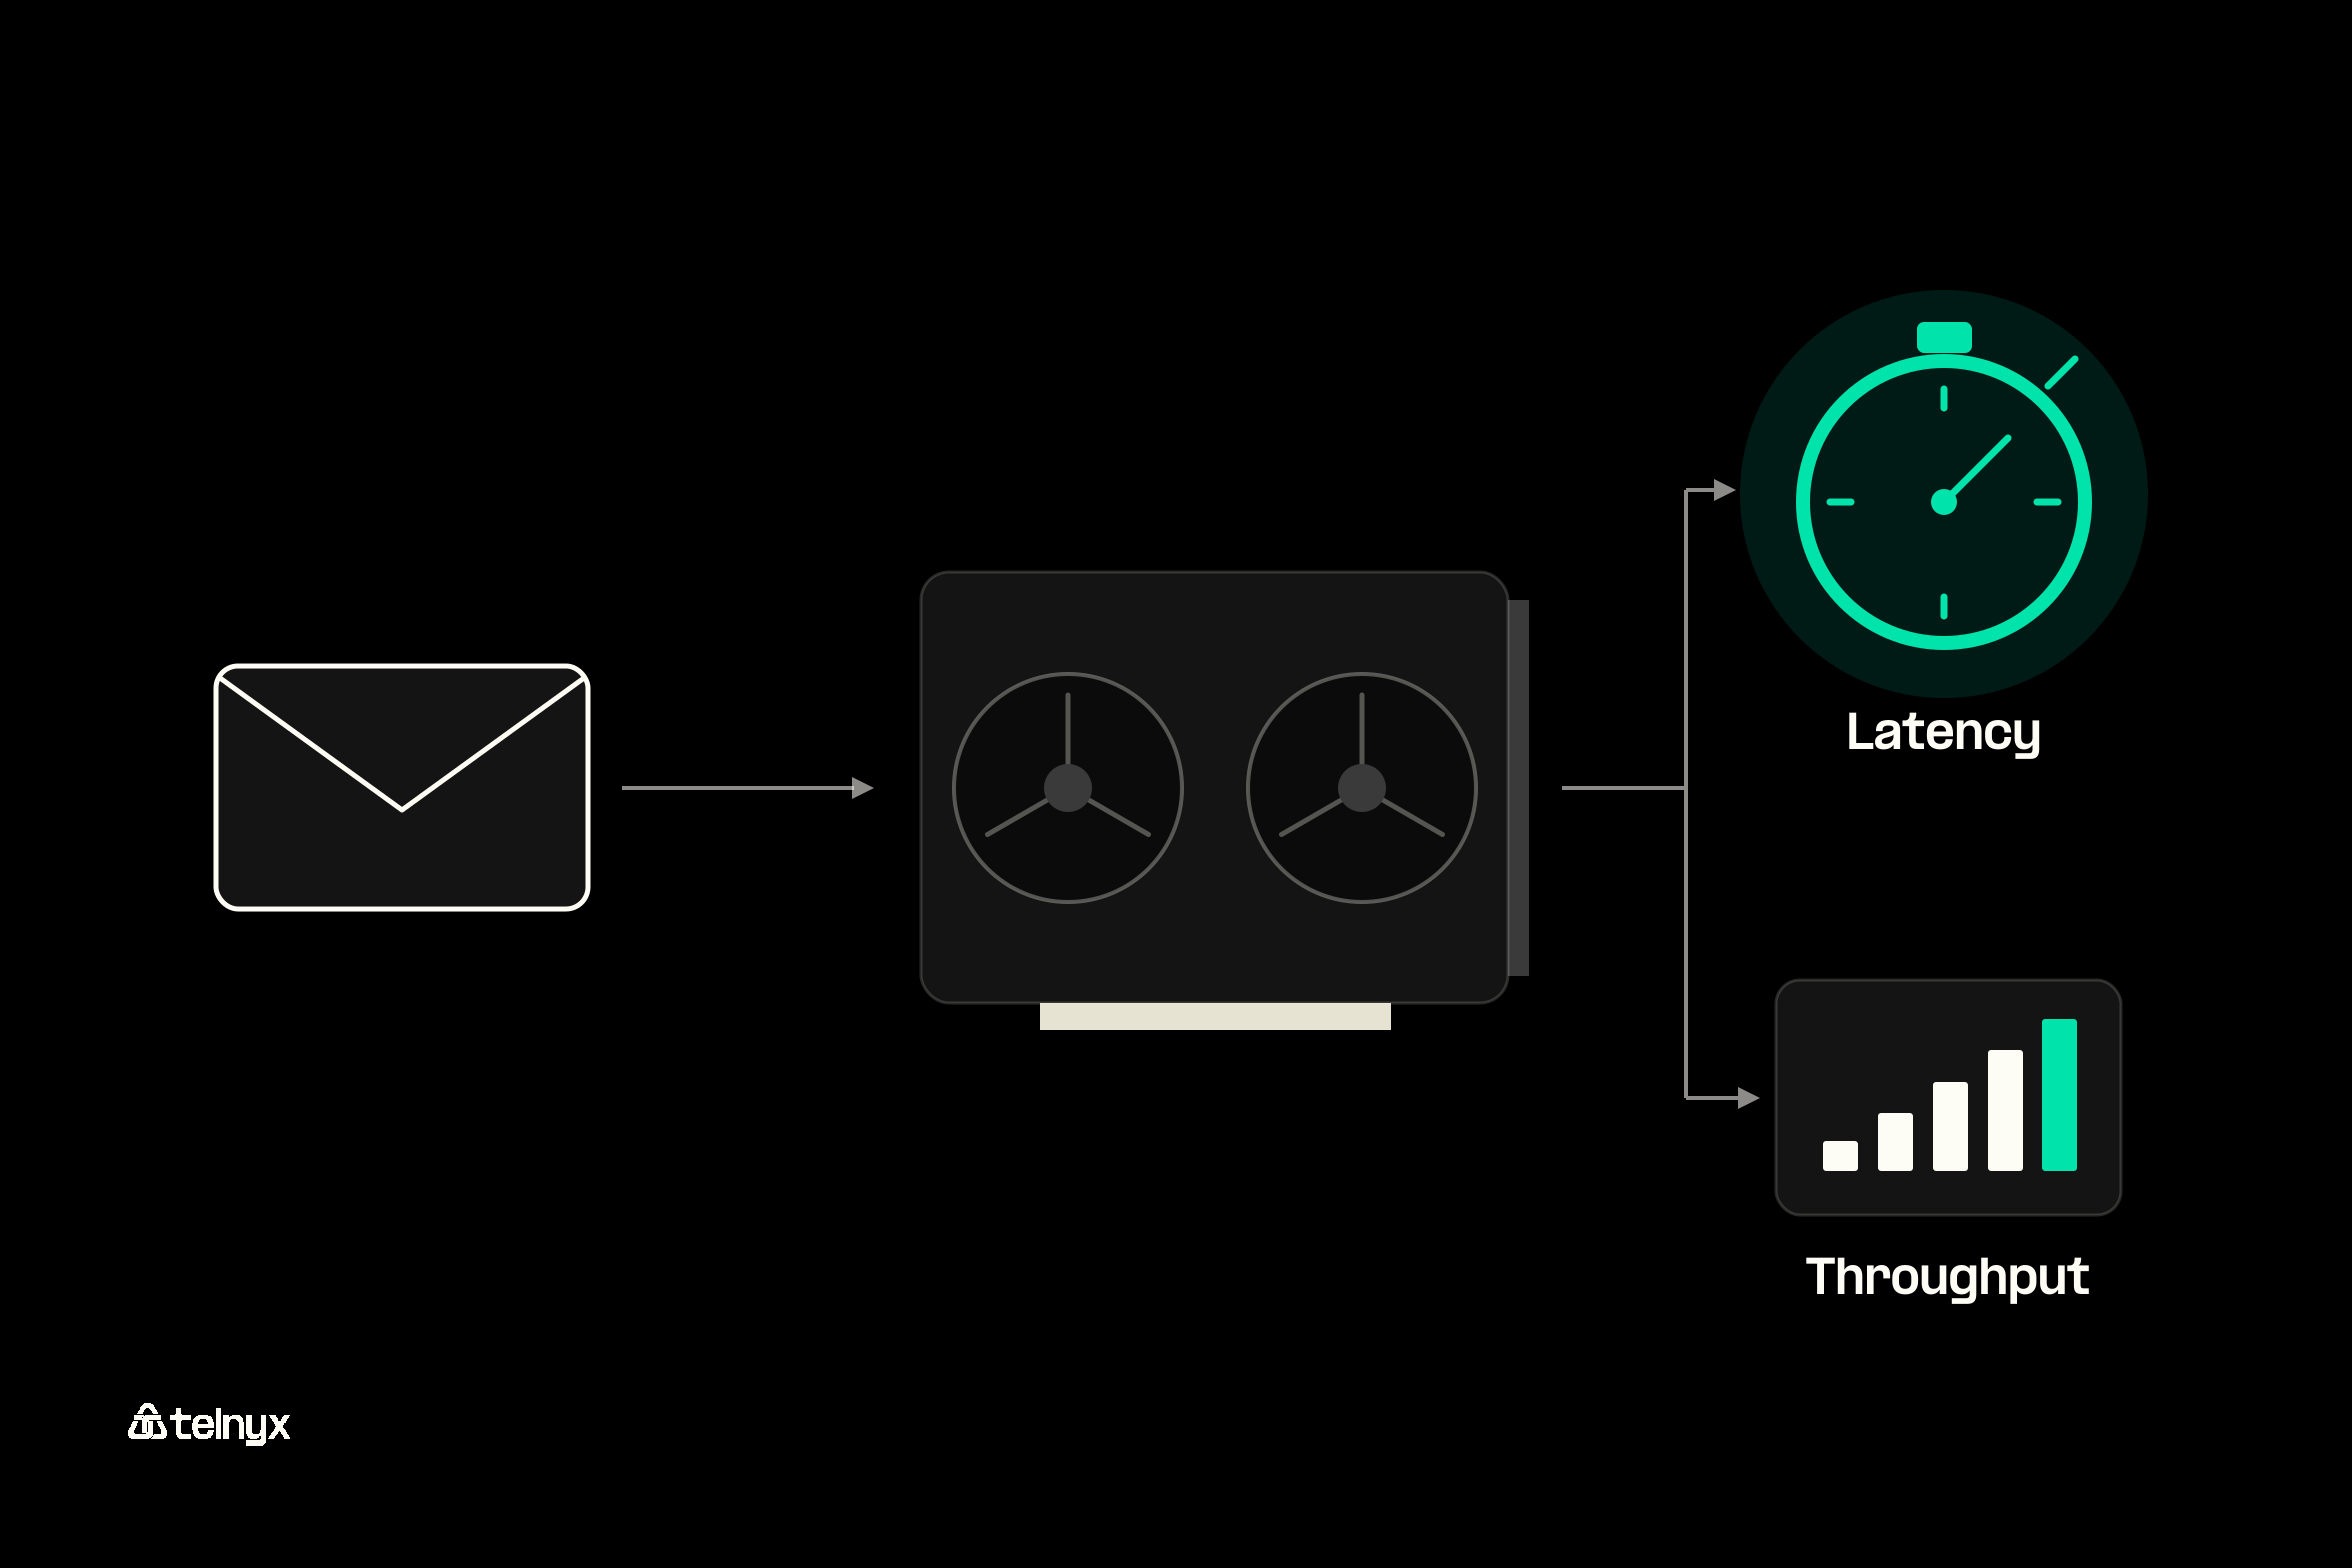
So which numbers should you look at? Most vendor decks draw on the same six. Keep this table open the next time one lands in your inbox.
The six numbers behind every inference benchmark
| Metric | In plain words | Who it matters to |
|---|---|---|
| Time to first token (TTFT) | How long you wait before the first word appears | Your chat or voice user, sitting in silence until it does |
| Inter-token latency (TPOT) | The gap between words once the answer starts streaming | Your user reading the answer as it arrives |
| Tokens per second per GPU | How much text one GPU produces across everyone it serves | Your batch jobs, and the provider's cost per GPU |
| Tokens per second per user | How fast one request gets its answer at a given load | Your agent's end-to-end task time |
| p99 latency | The wait that 99 of 100 requests come in under | Your SLA, and whoever is on call at 2am |
| Cost per million tokens | What you pay for input, cached input, and output | Your finance team. Telnyx publishes per-token rates by model and tier |
Why can't a provider max out throughput and speed per user at once?
Because a GPU serves many requests at the same time by batching them, and batching is a trade. A bigger batch keeps the GPU busy, so tokens per second per GPU climbs. Each request gets a smaller slice of every step, though, so tokens per second per user drops.
The InferenceX benchmark from SemiAnalysis (formerly InferenceMAX) compares this to a bus and a sports car. The bus moves the most people per hour. The sports car gets one person there first. Both are useful, and you need to know which one the vendor measured.
Ask this: “At what tokens per second per user did you measure that throughput?” InferenceX puts the stakes plainly. Four times the throughput is worthless for a chatbot if each user only gets 5 tokens per second.
How long will your user actually wait?
Two numbers decide it. Time to first token (TTFT) is the pause before anything appears. Inter-token latency, which some benchmarks call time per output token (TPOT), is the pace after that. E2E Networks' benchmark guide adds them up like this:
Formula: total latency = TTFT + (number of tokens x inter-token latency)
What does that look like in practice? For a voice agent, TTFT is most of what a caller hears as delay. For an agent that writes 1,000 tokens before it calls a tool, the second half of the formula takes over: at 20 ms per token, that's 20 seconds of waiting.
There's one more number many slides leave out, and that's the tail. An average or a median describes a typical request. Your p95 and p99 describe the 1 in 20 and the 1 in 100 that run slow, and those are the requests that break SLAs and fill support queues. Ask every provider for p99 TTFT and p99 inter-token latency at the concurrency they quote.
Before you benchmark: check the per-token pricing by tier so cost per million tokens sits next to latency from your first run. On the Telnyx inference pricing page in October 2026, DeepSeek V4 Flash lists at $0.13 per million input tokens, $0.03 per million cached input tokens, and $0.26 per million output tokens.
Is your workload an online or an offline benchmark case?
That depends on whether someone is waiting for the answer. An online benchmark sends requests the way real users do and measures latency under that load. An offline benchmark hands the system a full queue and times how fast it empties, so only throughput counts. The inference engine matters here too. vLLM, SGLang, and TensorRT-LLM batch and schedule requests differently, so the same GPU can post different results on each.
Telnyx maps this split to tiers on one model. Priority gives you faster serving capacity for interactive work, such as contact center voice agents. Flex gives you the lowest rates for background jobs like offline evaluation and document processing, where minutes of end-to-end latency are fine. Default sits in between at standard rates, and it's the tier behind every published Telnyx benchmark.
Benchmark your traffic on Telnyx Inference
Send your own prompts to open-weight models on Telnyx-owned GPUs, with OpenAI-compatible endpoints so the base URL is the only change.
What's in the MLPerf Inference v5.1 benchmarks list, and what changed since v4.0?
MLPerf Inference is the benchmark you read before you buy or rent hardware. MLCommons runs it, many vendors submit to it, and results are audited. The MLPerf Inference Datacenter page holds one row per submitted system, plus a change log for results that were later pulled.
How do you read an MLPerf results row?
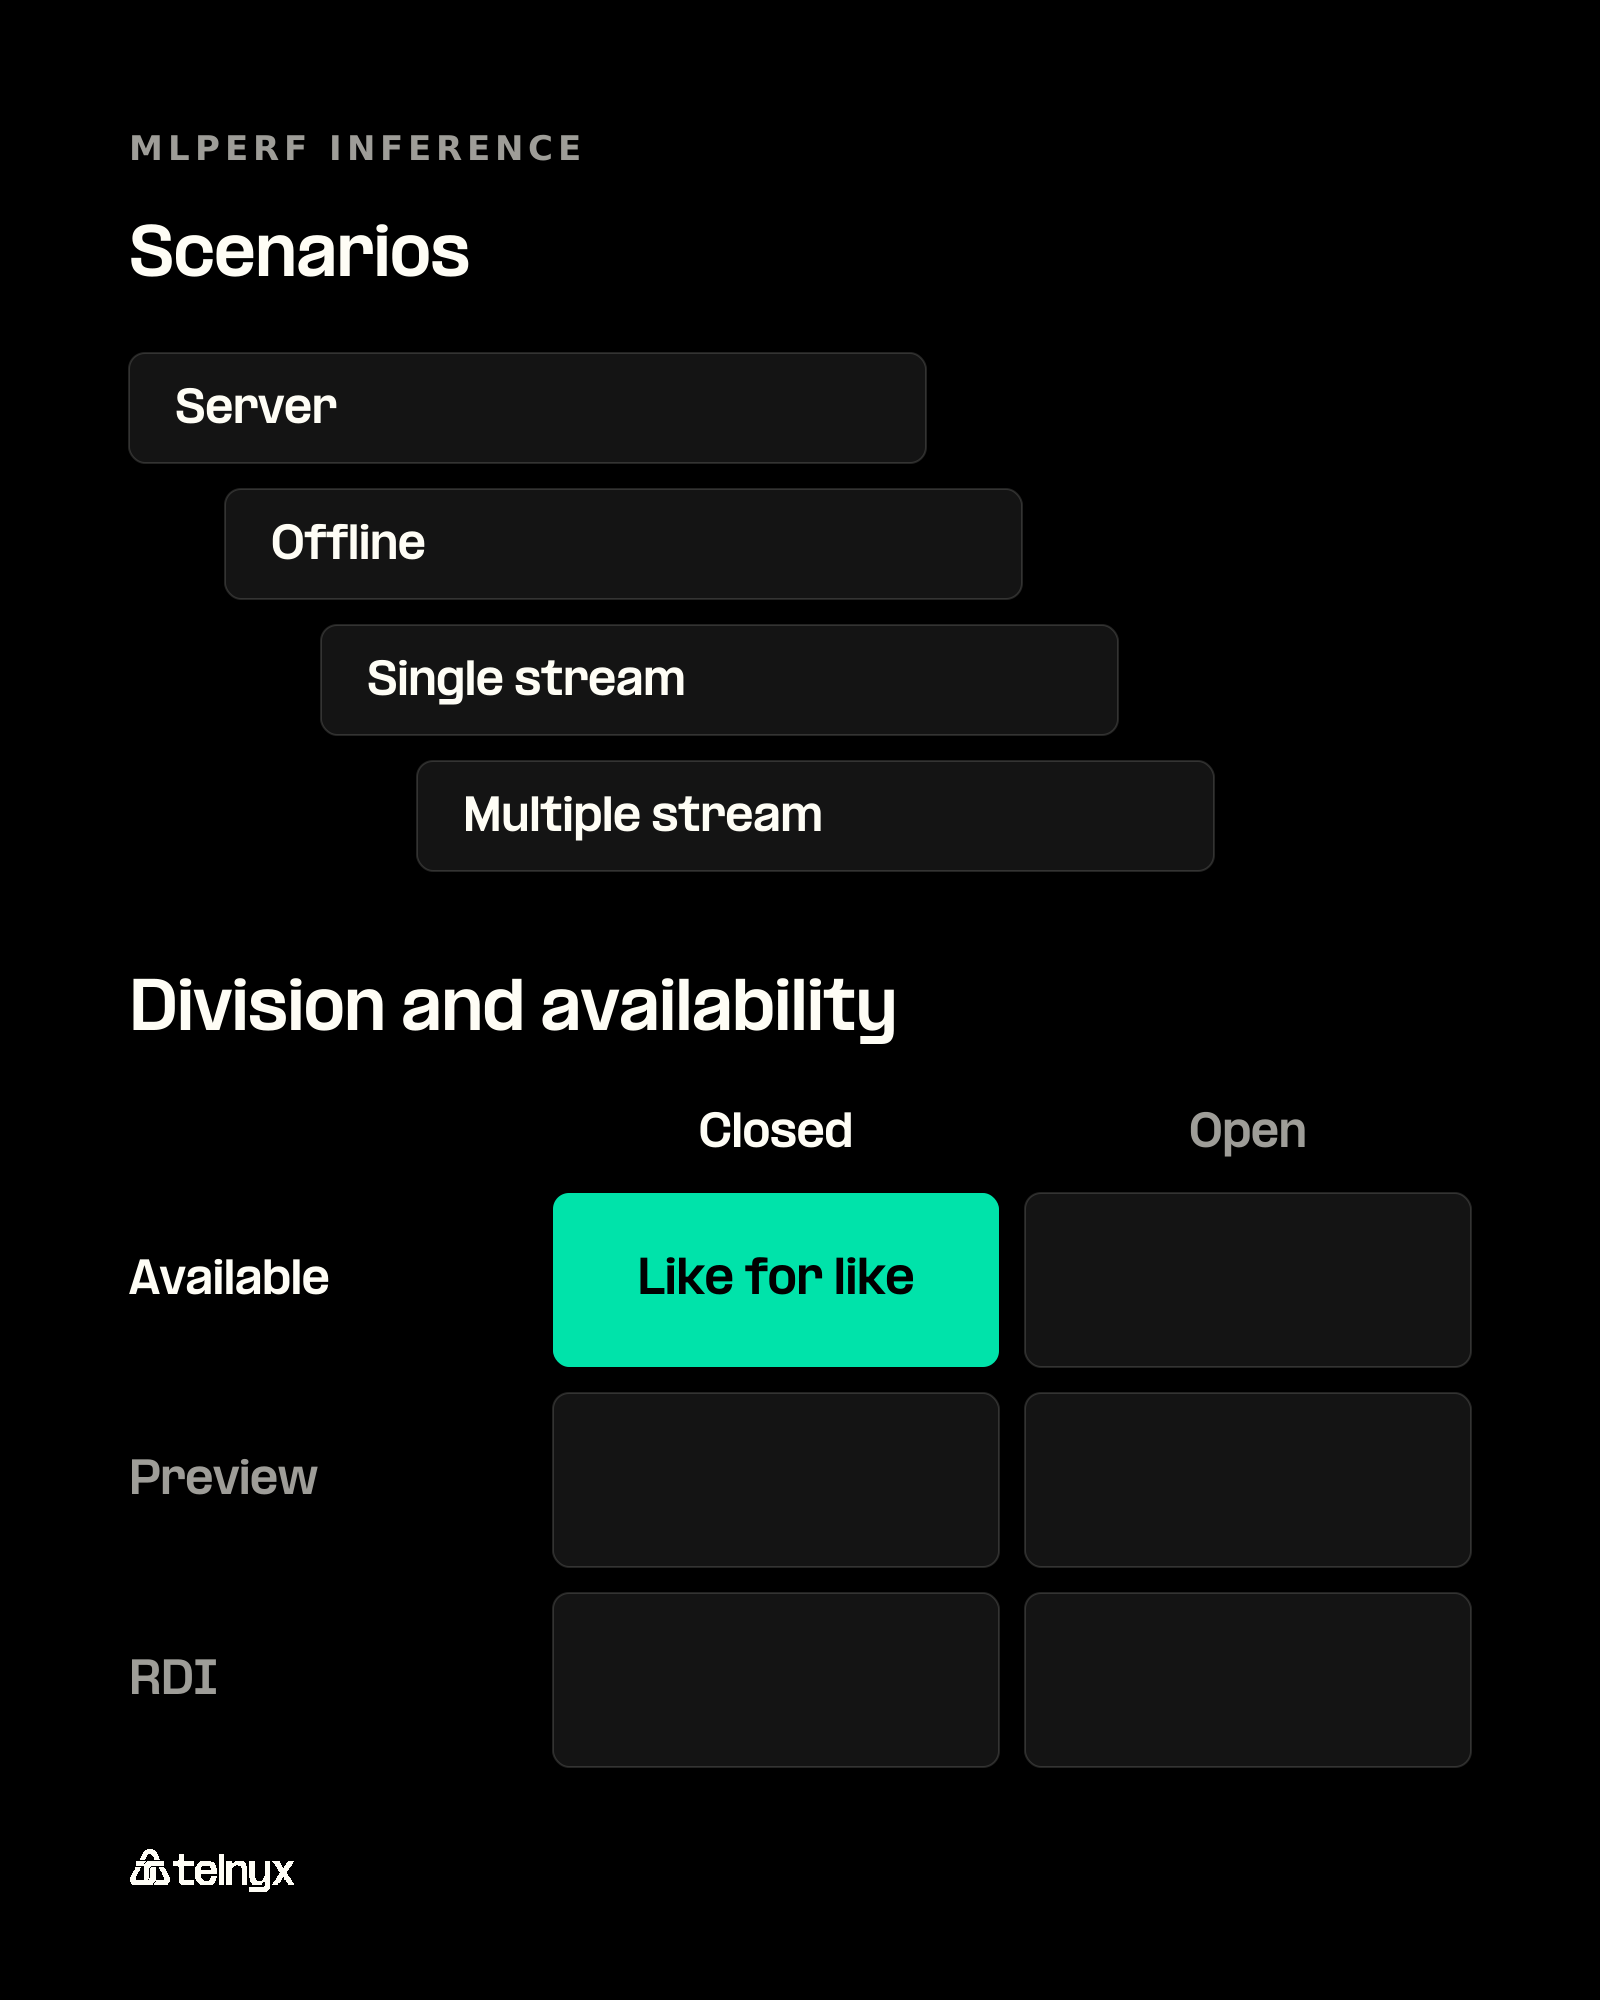
Think of each row as one submitter, one hardware and software stack, one benchmark, and one scenario. A benchmark is a dataset plus a quality bar the system has to clear. The scenario is how requests arrive, and there are four: Server sends requests at random times under a latency limit, Offline hands over everything at once, Single stream sends one query after another, and Multiple stream sends groups of samples per query.
Two labels then decide whether a row is any use to you. The division tells you which model ran. Closed means the submitter used the same model as the reference implementation, so Closed rows compare like for like. Open allows a different model or retraining and adds Model Used and Notes columns. The availability tag tells you whether you can get the system: Available means you can buy or rent it today, Preview means it must be Available by the next round, and RDI covers research, development, or internal hardware. MLCommons also measures full-system power at the wall and doesn't validate TDP or power supply ratings.
Quick test for any MLPerf claim: ask for the division and the availability tag. Only a Closed, Available row is evidence you can buy against. Open and RDI rows show what's possible.
What's in the MLPerf Inference v5.1 benchmarks list?
Three new tests arrived with v5.1 on September 9, 2025: DeepSeek-R1, the suite's first reasoning model, Llama 3.1 8B, which replaced the older 6-billion-parameter GPT-J as the small LLM test, and Whisper Large V3 for speech-to-text. The round also stretched interactive scenarios, which set tighter limits on TTFT and inter-token latency, to more LLM tests, including Llama 3.1 405B.
What did the v5.0 and v4.0 benchmarks lists look like?
Version 5.0 (April 2, 2025) added Llama 3.1 405B, Llama 2 70B Interactive, RGAT as a graph neural network test, and Automotive PointPainting for edge systems. Version 4.0 (March 27, 2024) added Llama 2 70B and Stable Diffusion XL. Two rounds have shipped since, v6.0 on April 1, 2026, and v6.1 on September 16, 2026, which is the current suite. Here's every round side by side, from the MLCommons release notes.
MLPerf Inference datacenter rounds, v4.0 to v6.1
| MLPerf round | Benchmarks added | What changed |
|---|---|---|
| v4.0 (March 2024) | Llama 2 70B, Stable Diffusion XL | First large LLM and first text-to-image test |
| v5.0 (April 2025) | Llama 3.1 405B, Llama 2 70B Interactive, RGAT, Automotive PointPainting (edge) | Interactive scenario with TTFT and TPOT limits, inputs and outputs up to 128,000 tokens |
| v5.1 (September 2025) | DeepSeek-R1, Llama 3.1 8B, Whisper Large V3 | First reasoning model, Llama 3.1 8B replaces GPT-J, interactive scenarios on more LLMs |
| v6.0 (April 2026) | DeepSeek-R1 Interactive, Qwen3-VL-235B-A22B, GPT-OSS-120B, Wan 2.2 text-to-video, DLRMv3 | First multimodal and first text-to-video tests, first sequential recommender |
| v6.1 (September 2026, current) | End-to-End RAG, Agentic Edge Inference | 10 datacenter and 6 edge benchmarks, new Interactive scenario for the Qwen3 VLM, speculative decoding allowed in GPT-OSS-120B Interactive |
What do RTX 5090 LLM inference benchmarks tell you?
They tell you what one person sees running one model on one card, which is useful as long as that's your question. Before you use a 2026 RTX 5090 review to judge a production service, check how the test was run. If it sent one request at a time to one model file, you're looking at the sports-car end of the curve from earlier.
Why doesn't a single-user number predict serving throughput?
With one request in flight, the GPU only ever works on one conversation, so the review's tokens per second is really a tokens-per-user figure. It can't show you how the card behaves with dozens of sessions sharing it, and you can't turn it into a cost per million tokens for a service. Here's what changes between a desk and a data center:
- Batch size. A serving node batches many requests per step, which moves the result along the throughput curve.
- KV cache memory. Every live conversation keeps its own working memory on the GPU, so memory can cap how many users you serve before compute does.
- Multi-GPU parallelism. Large models split across several GPUs, which adds communication between cards that a single GPU never sees.
- Runtime. A desktop test often uses a local runtime, while serving benchmarks such as InferenceX run vLLM, SGLang, or TensorRT-LLM.
- Request arrival. Real traffic arrives at random and in bursts, while a review sends the next prompt only when the last one finishes.
When is an RTX 5090 benchmark the right one to read?
When the question is personal. If you're running a model locally for yourself, testing prompts on a workstation, or checking whether a quantized model feels responsive at your desk, a single-user number is exactly what you want. Just check the setup and the date first.
Version rule: inference engines ship releases days apart, so an RTX 5090 number without the runtime version, the model file and its quantization, and the test date is already stale.
How do you read llama.cpp inference benchmarks and AirLLM numbers?
Local runtimes like llama.cpp and AirLLM benchmark one user on one machine, and each reports speed its own way. Here's how they compare with a self-hosted server and a hosted API.
Local runtimes compared with hosted inference
| Runtime or service | What its benchmark measures | Fits when |
|---|---|---|
| llama.cpp | Prompt reading and answer writing speed, one user, local hardware | You run a quantized model on your own machine |
| AirLLM | Whether a large model runs at all in small memory, slow by design | You need a model larger than your GPU memory |
| vLLM or SGLang, self-hosted | Serving throughput against latency with many users | You operate your own GPUs |
| Telnyx Inference API | Hosted TTFT and total time including network, in-region, Default tier published | You want a hosted model compared on your real prompts |
What do the two llama.cpp benchmark speeds mean?
Think of every request in two halves: first the model reads your prompt, then it writes the answer. The llama-bench tool in llama.cpp reports a speed for each. Prompt processing, labeled pp and run on 512 tokens by default, is the reading half, also called prefill, and it sets your time to first token. Token generation, labeled tg and run on 128 tokens by default, is the writing half, also called decode, and it sets how fast the answer streams.
Why keep them apart? A 1,000-token agent prompt leans on the reading half, a 1,000-token answer leans on the writing half, and one blended tokens-per-second figure hides which half is slow. Compare each number with its hosted counterpart.
Version rule: a llama.cpp or AirLLM figure without the commit or release, the quantization level, and the hardware can't be compared with anything.
What do AirLLM inference speed benchmarks trade away?
Speed, on purpose. AirLLM loads a model one layer at a time, so a model far bigger than your GPU's memory can still run on a small card. Its benchmarks answer a feasibility question: will this model run on this hardware at all? Take any AirLLM figure from the project's own repository, check its date, and treat it as a floor.
How do you send the same prompt to a hosted inference API?
With one request. The Telnyx Inference API is OpenAI-compatible, as the OpenAI compatibility guide shows, so the prompt you ran locally goes straight to api.telnyx.com/v2/ai/chat/completions. Pick a model from the available inference models, drop your prompt into the content field, and time the call. If your client streams the response, the first token gives you TTFT and the last one gives you total time.
curl -i -X POST "https://api.telnyx.com/v2/ai/chat/completions" \
  -H "Authorization: Bearer $TELNYX_API_KEY" \
  -H "Content-Type: application/json" \
  -d '{
    "model": "moonshotai/Kimi-K3",
    "messages": [{"role": "user", "content": "Hello, World!"}]
  }'
Keep in mind that a hosted run includes network time your local run doesn't. Telnyx runs models in-region across the Americas, Europe, MENA, and APAC, on GPUs that sit on its own network, so pick from the inference regions closest to your users before you compare.
How do you run inference benchmarks against a hosted API with your own traffic?
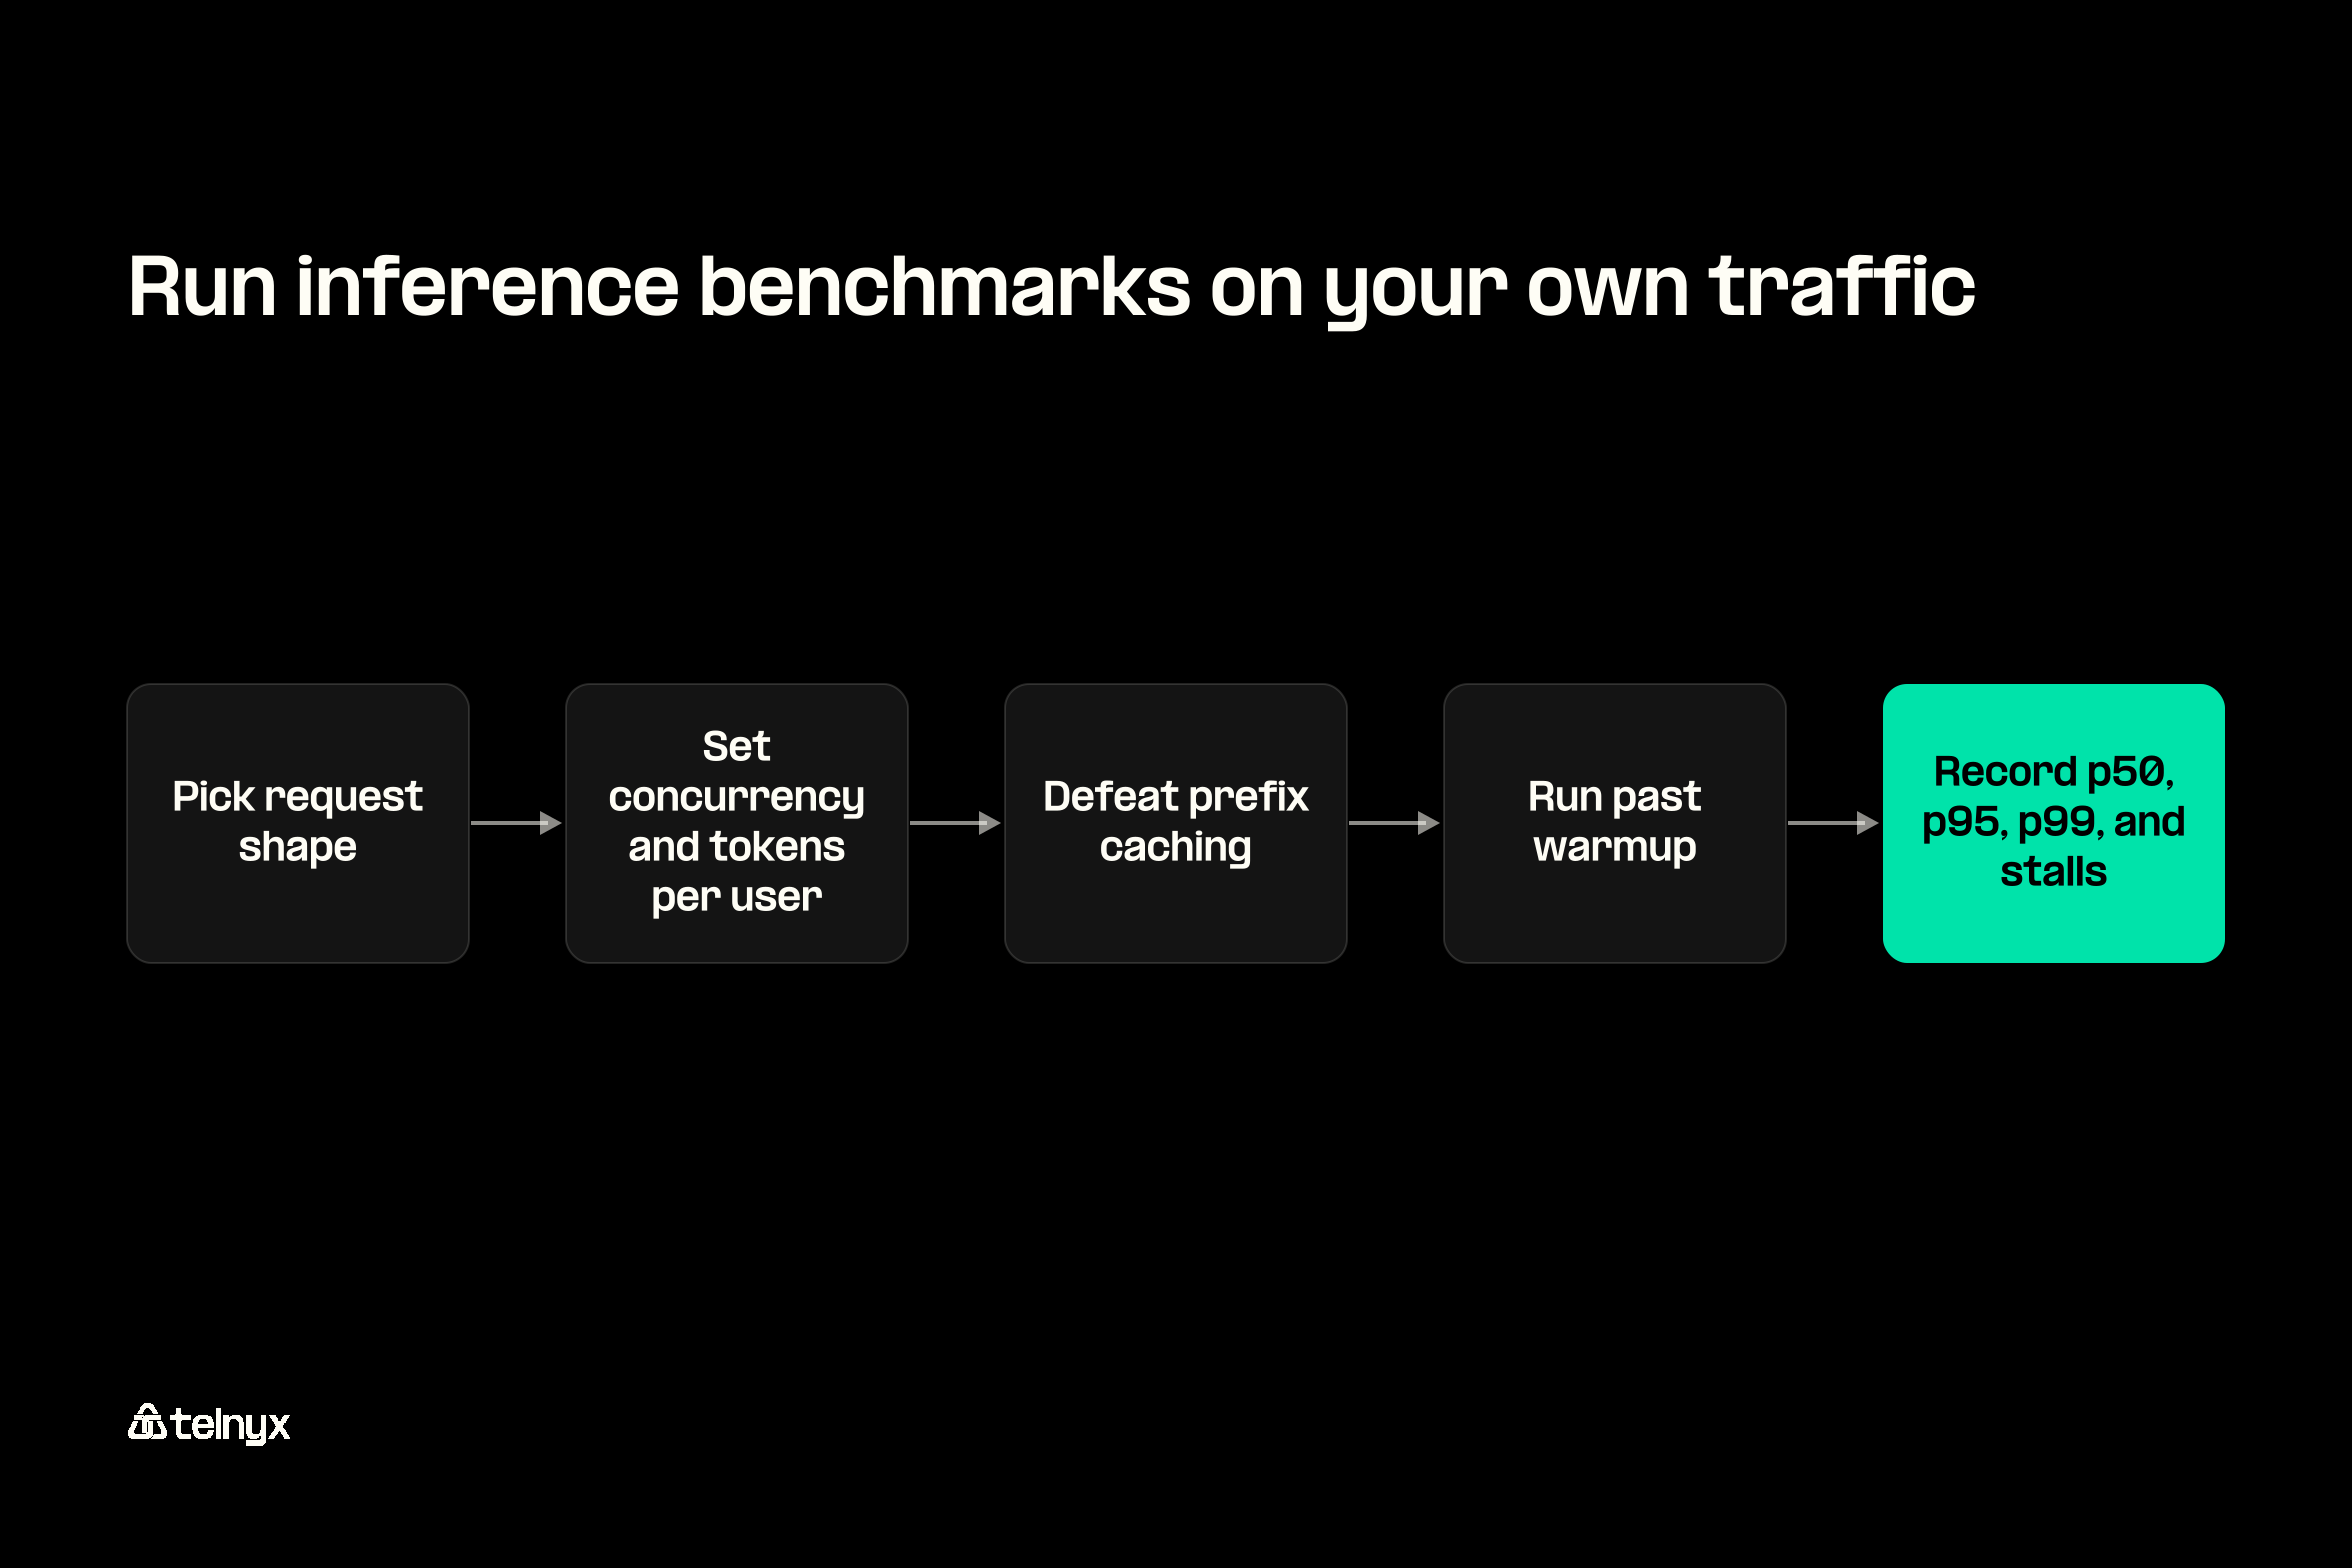
You fix five things before the first request goes out, and after that the afternoon is mostly waiting for results:
- Pick a request shape that matches your real traffic.
- Set concurrency to your own peak and hold tokens per user at a fixed target.
- Defeat prefix caching, unless your production traffic depends on it.
- Run past warmup, so cold starts don't skew the numbers.
- Record p50, p95, and p99, plus every stall.
The same list works as a filter for vendor numbers. If a published inference benchmark doesn't tell you all five, you can set it aside in under a minute. Telnyx publishes its provider benchmarks from GPUs it owns and states that every published result refers to the Default tier, so you know the serving point behind each number.
What request shape should you test?
Whatever your logs say. Pull the input and output lengths of real agent calls, then pick the closest standard shape. InferenceX uses 1024 in / 1024 out for chat, 1024 in / 8192 out for reasoning, and 8192 in / 1024 out for summarization. It also varies input length between 80 and 100 percent of target, so the engine can't tune itself for one exact length. E2E Networks' task profiles add 128:128 for simple chat, 2024:128 for RAG, 1024:30 for classification, and 200:2024 for creative writing. If you run e-commerce AI agents, catalog and order lookups usually look like the RAG shape, with long retrieved context and short answers.
What about concurrency and caching? Set concurrency to your own peak and hold tokens per user at a fixed target, so results from different providers describe the same experience. Prefix caching lets a server reuse work when many requests start with the same text. That's a real saving in production if your agents share a long system prompt, and it flatters a benchmark that sends the same prompt 400 times. Use random inputs unless your production traffic reuses a prompt, in which case keep the cache on and price those tokens as cached input.
Warmup rule: decide before you run whether warmup requests count. In InferenceX, all parties agreed to disallow warmup and extend run length by up to 5x instead, so cold starts and just-in-time compilation are absorbed inside the measured run.
Why measure the tail, not the median?
Because the tail is where providers differ. Outlier cells and stalls decide what your users feel, and a median smooths them away.
| Look at the benchmarks. Together had 15 outlier cells including a 143-second stall. We had 4. When you're orchestrating on rented cloud GPUs, you can't guarantee consistent throughput because you don't control the hardware underneath. That inconsistency doesn't show up in median latency numbers, it shows up at 2am when your production traffic hits a noisy neighbor. Baseten doesn't publish benchmarks at all, which tells you something. Regis David Souza, Telnyx |
|---|
So what's an outlier cell? Picture your benchmark as a grid, with one cell for each combination of request shape and concurrency. A cell is an outlier when its latency blows past your percentile target. Keep every raw per-request timing, because a 143-second stall disappears inside the average of 400 requests. Then record p50, p95, and p99 for TTFT and inter-token latency, plus a count of stalls.
If you have a developer, this loop sends the documented request 400 times over 16 concurrent connections, one request file per call, and writes time to first byte and total time for each request:
# req-1.json to req-400.json hold real prompts with varied lengths
seq 1 400 | xargs -P 16 -I{} curl -s -o /dev/null \
  -w "%{time_starttransfer} %{time_total}\n" \
  -X POST "https://api.telnyx.com/v2/ai/chat/completions" \
  -H "Authorization: Bearer $TELNYX_API_KEY" \
  -H "Content-Type: application/json" \
  -d @req-{}.json >> timings.txt

# p50, p95 and p99 of total time, in seconds
sort -n -k2 timings.txt | awk '{t[NR]=$2} END {
  print "p50", t[int(NR*0.50)], "p95", t[int(NR*0.95)], "p99", t[int(NR*0.99)] }'
Without streaming, the first byte arrives with the whole answer, so both columns track total time. For TTFT, start from the run-llm-inference-python example in the Telnyx code examples repository, which calls the same endpoint through an OpenAI-compatible client. Stream the response and record when the first chunk and the last chunk arrive for every request.
Which serving tier does a published number refer to?
On Telnyx, the Default tier, every time. Priority and Flex change the serving point on the same hosted model through one field in the request body, so you can test both ends without adding a second provider. The service tier docs list which models support each tier.
Telnyx Inference service tiers
| Tier | Serving point | Use it for |
|---|---|---|
| Default | Standard capacity at standard rates. Every published Telnyx benchmark refers to it. Omit service_tier to get it | General traffic, and like-for-like comparison with published results |
| Priority | Faster serving capacity at a different rate, on select models | Low-latency interactive work, including orchestration for Voice AI agents |
| Flex | Lowest rates, minutes of end-to-end latency acceptable, US only, select models | Offline evaluation, document processing, and background summarization |
Which tier should you benchmark? The one you'll run in production. If you move tens of billions of tokens a month, split the test by job: agent calls on Default or Priority, evaluation and summarization on Flex, each priced per million tokens at its own tier.
Inference benchmarks FAQ
How do I benchmark an open-weight model against the closed model my agents use today before I move any traffic?
Run the same test against both. Replay a sample of real agent calls at your peak concurrency, record p50, p95, and p99 TTFT and inter-token latency, and price each run per million tokens, including cached input. The Telnyx Inference API is OpenAI-compatible, so your existing client needs only a new base URL and model name. Check output quality on the same sample before you compare speed.
Are open-weight models far behind closed models on multimodal benchmarks, and how long until they catch up?
It depends on the task, and no benchmark can tell you when a gap closes. Open-weight vision-language models are now standard test subjects, though. MLPerf Inference v6.0 made Qwen3-VL-235B-A22B its first multimodal benchmark in April 2026, and Telnyx hosts Kimi K3, a multimodal model with a 1 million token context. Your best answer comes from testing candidate models on your own images and documents.
What does an inference benchmark really measure, and what does it leave out?
It measures how quickly and consistently a hardware and software stack answers requests at a given load: time to first token, inter-token latency, throughput per GPU, and tokens per user. It leaves out model quality, your request shape unless the test happens to match it, network time unless you measure from your side, and often the tail, since many results report a median or a single throughput point.
Why do inference benchmarks go out of date so quickly?
Because software moves faster than hardware. Inference engines ship releases days apart, and MLCommons reported with its v6.1 results on September 16, 2026, that the best per-accelerator DeepSeek-R1 Server result was 5.7 times the v5.1 figure from a year earlier. A benchmark without a date and a runtime version may describe a stack that no longer exists.
What is the difference between the MLPerf Closed and Open divisions?
The Closed division requires the same model as the reference implementation, so its results compare hardware and software like for like. The Open division allows a different model or retraining and adds Model Used and Notes columns. Open rows show what a stack can do with changes, so don't use them as a purchase comparison.
“ Run your own tail-latency check this afternoon”
“ Send your real traffic shape to open-weight models on the Telnyx Inference API and read your own p99. The endpoints are OpenAI-compatible, so the base URL is the only change, and per-model, per-tier pricing is published for you to set beside the results.”